A planning cycle is a value stream of information
In the realm of Lean, a value stream is every step required to deliver a product or service from start to finish. In budgeting and forecasting, the flow is not material: it is information, strategy, assumptions, operating inputs, financial analysis and approvals.
The customer defines value. For a board and operating leaders, that value is one timely, trusted number they can use to make decisions and commit resources. A planning cycle that produces a polished board pack only after repeated manual reconciliation may complete its tasks, yet still deliver information too late to be useful.
Value stream mapping (VSM) makes the end-to-end flow visible, including handoffs, elapsed time, processing effort and rework. The Lean Enterprise Institute’s overview of VSM similarly emphasizes mapping both current and future states to guide improvement.
Select a clear scope: the annual budget
Consider a hypothetical six-site services group with 1,900 employees. Its finance team runs an annual budget build and quarterly reforecast. For the first VSM, select the annual budget cycle, from strategy guidance to board approval.
This is a practical starting point because it has the longest lead time, the most rework and the biggest opportunity to improve the planning system. The quarterly reforecast can then reuse the improved definitions, data sources and operating cadence.
Set the scope boundary clearly:
- Start: leadership issues the strategy guidance pack.
- Finish: the board approves the plan and Finance sets the reforecast baseline.
- Customers: board members and operating leaders.
- Measures: calendar lead time, Finance touch time, first-pass accuracy, iteration count, forecast variance and cycle cost.

Current state: follow the information, not just the spreadsheet
The figures below are illustrative baseline assumptions for the example organisation. “Process time” means analyst and central Finance effort; calendar time includes waiting, queues and review windows. The completeness-and-accuracy rate (% C&A) records the share of outputs meeting agreed requirements at that step.
| Current-state step | Elapsed time | Process time | % C&A |
|---|---|---|---|
| Strategy guidance pack prepared | 5 days | 6 hours | 100% |
| 214 cost centre templates issued | 3 days | 3 hours | 95% |
| Six sites prepare and submit inputs | 21 days | 18 hours | 69% |
| Finance consolidates submissions | 8 days | 12 hours | 83% |
| First-cut review | 7 days | 8 hours | 90% |
| Challenge sessions with operating leaders | 10 days | 10 hours | 93% |
| Capital requests prioritised | 6 days | 5 hours | 96% |
| Four iteration rounds | 28 days | 7 hours | 99% after correction |
| Reforecast baseline set | 2 days | 2 hours | 100% |
| Board pack produced and approval obtained | 7 days | 3 hours | 98% |
| Total | 97 days | 74 hours | – |
The figures show why touch time alone is not the full story: 74 hours of Finance effort sits inside a 97-day elapsed cycle. Each of the four iteration rounds adds approximately 6–9 days, with an average of seven days in this example.
Of 214 first submissions, a 31% error and rework rate means about 66 submissions need correction. Finance also touches 62 spreadsheet models by hand, creating additional version-control and reconciliation work. The result is a process that eventually reaches a board-approved plan, but only after information has passed through repeated queues and reviews.
Where the eight DOWNTIME wastes appear
Use DOWNTIME to identify waste in terms the finance team can act on:
- Defects: template version drift or inconsistent assumptions generate corrections.
- Overproduction: reports are prepared even when leaders do not use them to make decisions.
- Waiting: Finance waits for late submissions, clarifications or approval.
- Non-utilised talent: analysts spend skilled time chasing data instead of analysing drivers.
- Transportation: figures are transferred between spreadsheets, finance systems and HR or operational platforms.
- Inventory: unapproved assumptions and draft budgets accumulate in queues.
- Motion: people search multiple folders, workbooks and systems to locate the current figure.
- Extra-processing: manual reconciliations and repeated reviews duplicate checks.
These categories are not a reason to remove necessary controls. They help the team distinguish value-adding governance from avoidable effort.
Design a future state that serves the decision
The goal is not simply to make the existing annual budget faster. It is to create a more dependable planning flow, with an annual budget for formal resource commitments and a rolling, driver-based forecast for current decisions.
A future-state design could include:
- One governed source of truth for actuals, account and cost-centre definitions, approved assumptions and model versions.
- A driver-based model connecting service volume, revenue, staffing, capacity and major cost drivers to financial outcomes.
- Standard submission windows with clear ownership, built-in validation and templates pre-populated with trusted data.
- Pull from Finance business partners: site leaders update material changes when requested, rather than every cost centre rebuilding unchanged inputs.
- Automated consolidation with exception flags for missing, inconsistent or out-of-range data.
- Levelled challenge sessions scheduled by site or decision theme, so leaders arrive with comparable, validated information.
- A short board-pack cycle focused on key assumptions, scenarios, risks and decisions, not a catalogue of every working file.
A practical first target is a 45-day annual budget cycle with one major iteration round. The quarterly rolling forecast can then update a forward-looking view using changed drivers and actuals, rather than reopening the entire annual plan.
Current state versus future-state targets
These future-state figures are proposed improvement targets, not industry benchmarks. Validate them through a pilot and compare performance using consistent definitions. For context, APQC recommends tracking planning-cycle speed alongside forecast accuracy.
| Measure | Current state | Future-state target |
|---|---|---|
| Annual budget lead time | 97 calendar days | 45 calendar days |
| Finance process time | 74 hours | 42 hours |
| Iteration rounds | 4 | 1 major round |
| First-pass submission accuracy | 69% | 92% |
| First-submission error rate | 31% | 8% |
| Spreadsheet models touched by hand | 62 | 10 or fewer |
| Forecast variance (illustrative) | 12.4% | 8.0% |
| Central Finance labour cost per cycle | $7,770 | $4,410 |
The cost estimate applies an illustrative blended Finance labour rate of $105 per hour. That gives $7,770 for 74 hours and $4,410 for 42 hours. A potential $3,360 capacity release per annual cycle. At 1,720 productive hours per FTE-year, the 32 hours released equal about 0.019 FTE. This is recovered capacity, not an assumed headcount reduction; site submission time is not included in this central Finance estimate.
A 90-day kaizen sequence
Sequence improvements so the organisation stabilises the process before adding automation.
Days 1–30: Understand and standardise
- Confirm customer needs, scope, definitions and baseline measures.
- Walk through the process with site leaders, Finance business partners and approvers.
- Catalogue the 214 templates and 62 models; identify versions and required controls.
- Standardise submission rules, calendar windows and ownership.
Days 31–60: Pilot better flow
- Select one site or a representative group of cost centres.
- Pilot pre-populated templates, driver-based inputs and automated validation.
- Test a levelled challenge-session schedule and one agreed iteration protocol.
- Measure completion, accuracy, elapsed time and user feedback.
Days 61–90: Embed and scale
- Compare pilot results with the baseline and adjust controls.
- Automate consolidation and exception reporting where the process is stable.
- Train finance partners and site owners; publish standard work and decision rights.
- Scale the approach and set owners for monthly forecast measures and future kaizen.
Build the capability to lead the improvement
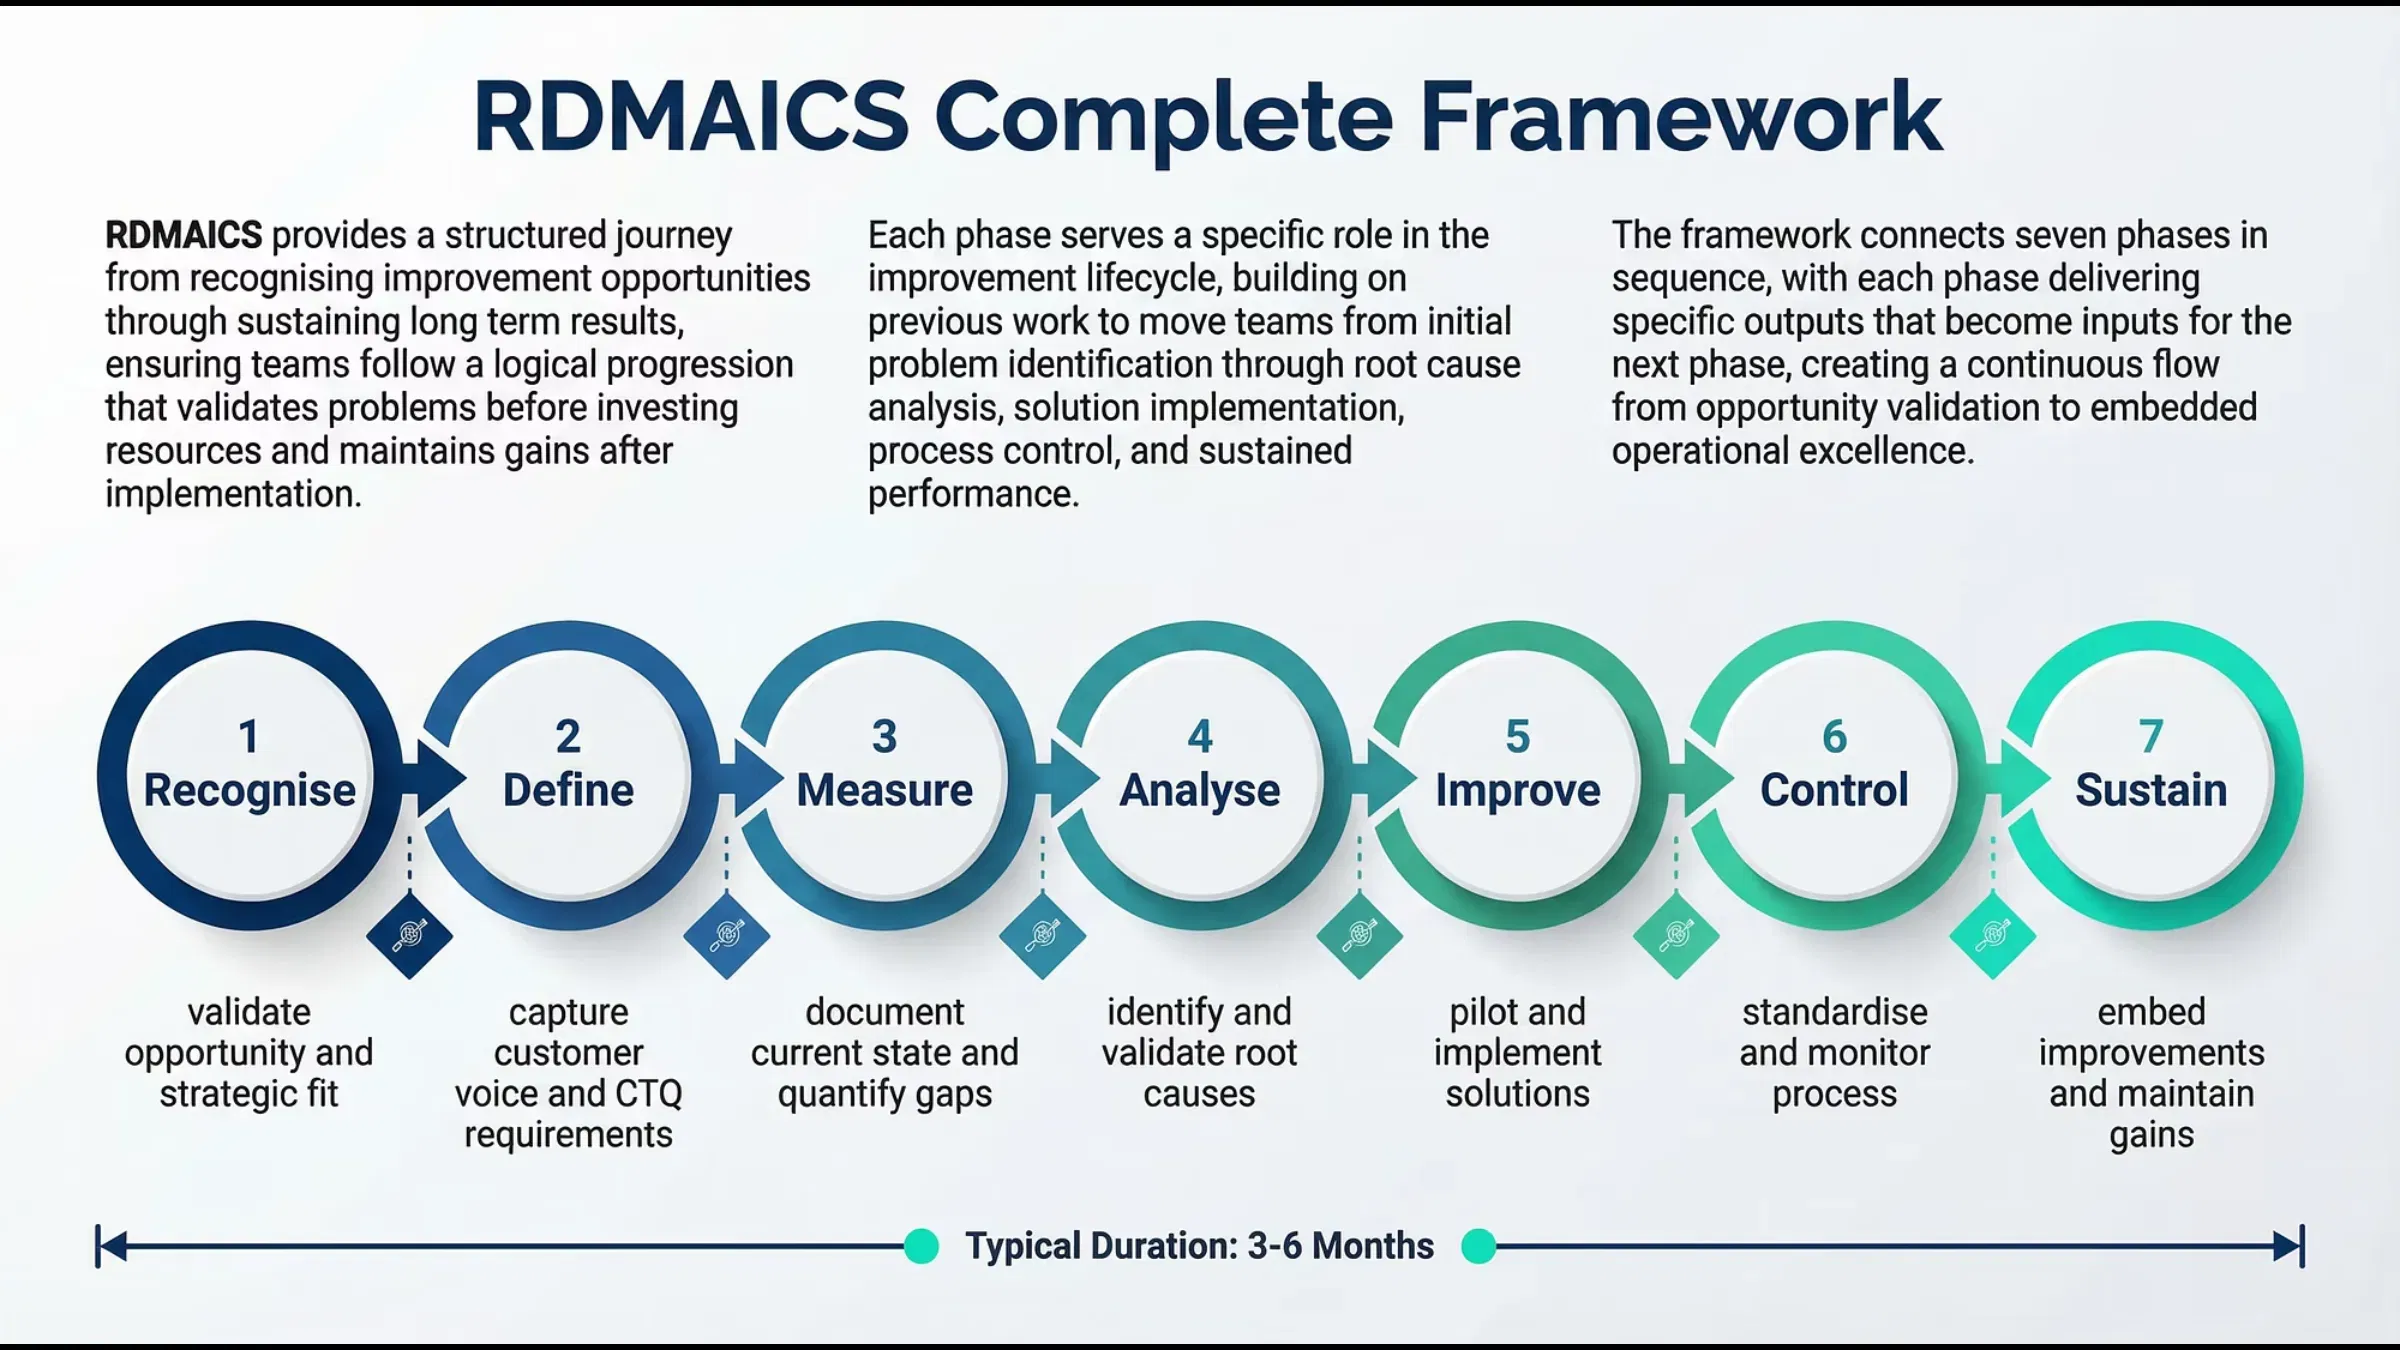
A successful budgeting VSM connects Lean flow principles with DMAIC: define the customer’s decision needs, measure the real cycle, analyse causes of delay and rework, improve the flow, then control and sustain the gains. The map becomes a practical management tool when owners review the measures and act on variation, not just when it is presented in a workshop.
Build this capability through Lean Six Sigma Hub’s self-paced online Green Belt or Black Belt courses. Both offer CSSC-accredited training with real-world simulations and an end-to-end DMAIC case study, supporting practical application from process mapping through sustained improvement.
Kaizen. Kai-Care. Kai-Done. Lean Six Sigma