1. Why Value Stream Mapping Matters in Frozen Dessert Manufacturing
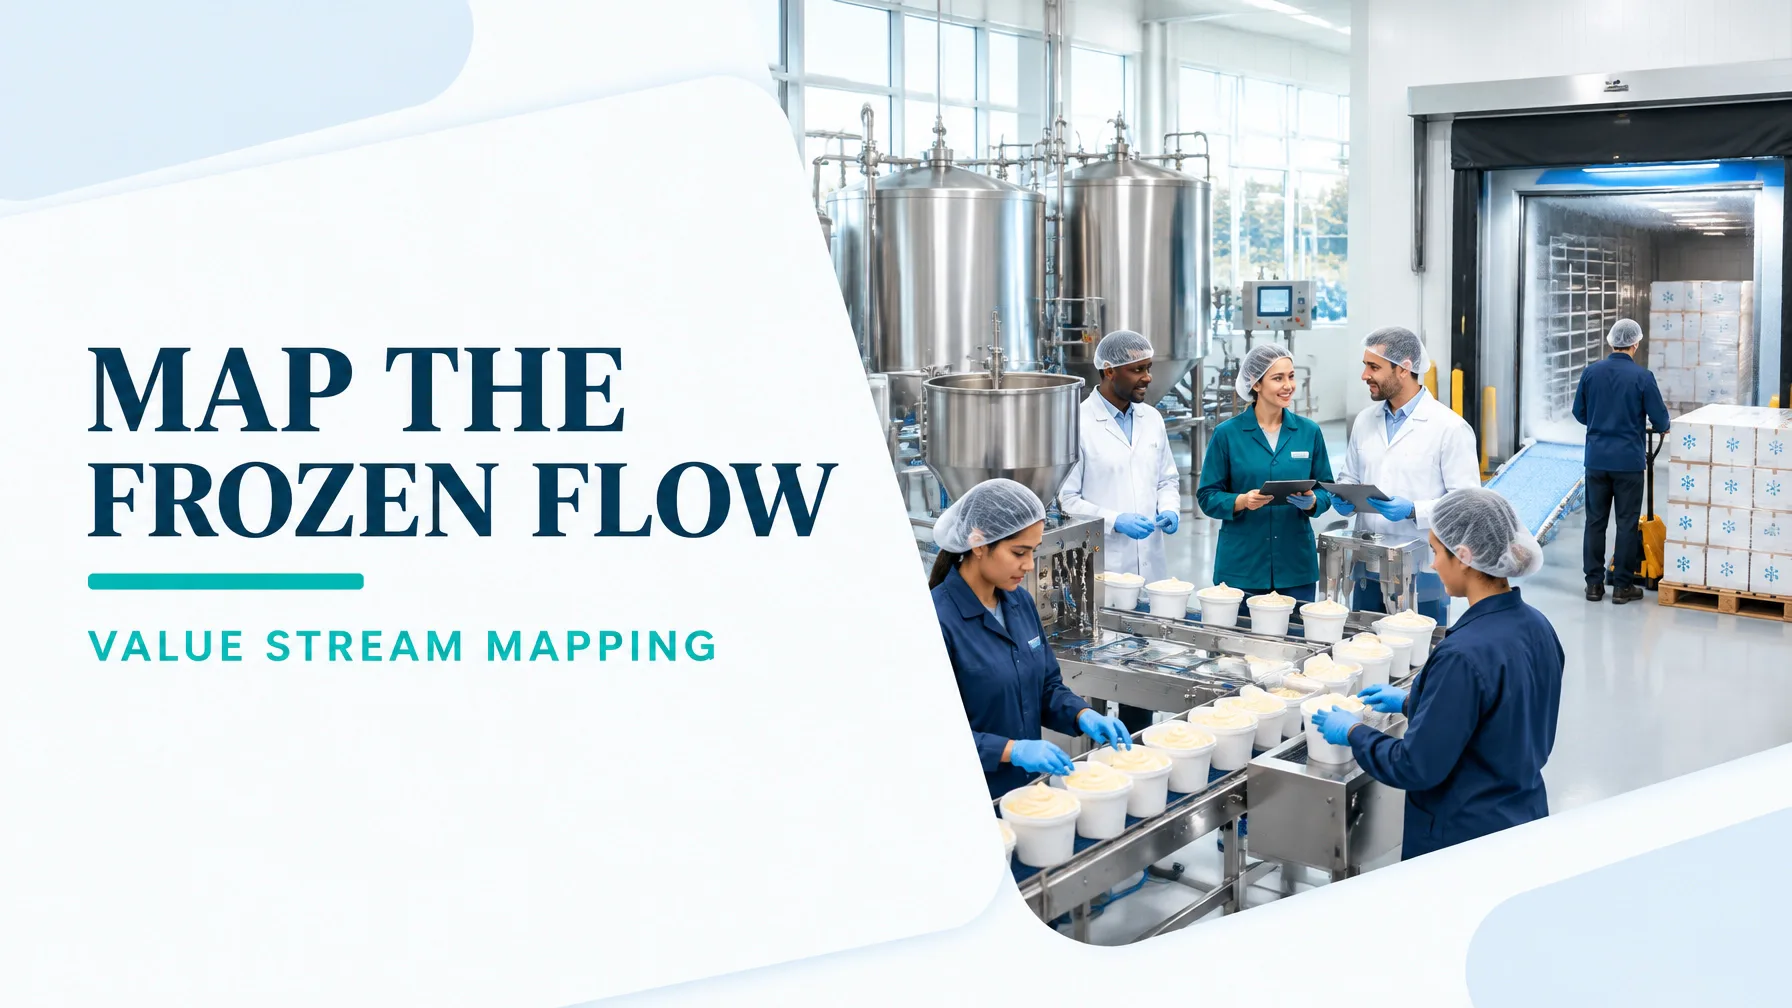
In the realm of frozen dessert manufacturing, customer value depends on more than producing a filled tub. The correct flavour, allergen profile, net weight, texture, packaging, temperature and delivery timing must all be achieved together.
This makes the sector unusually exposed to flow losses. Product moves through a sensitive transition from liquid mix to semi-frozen product, then through filling, hardening and frozen storage. At the same time, manufacturers must manage:
- Hardening-room residence time and slot availability
- Allergen changeovers across shared tanks, pipes, fillers and utensils
- Flavour and label sequencing across multiple SKUs
- Cold-chain temperature exposure during transfer, storage and dispatch
- Quality release requirements before product can move forward
A well-designed value stream mapping exercise makes these conditions visible. It connects material flow with information flow, including demand signals, production schedules, batch tickets, quality release, line clearance and dispatch instructions.
The technical process sequence is well established: mixing, pasteurisation, homogenisation, ageing, continuous freezing, filling and hardening. Tetra Pak’s ice cream processing handbook identifies ageing below 5°C for a minimum of four hours as an important preparation step before continuous freezing. The same source explains that filled products require hardening before transfer to storage.
The objective is not simply to make each process box faster. It is to design a connected stream that produces the right product at the right rhythm with controlled WIP and no unnecessary hardening-room hold.
2. Scope Selection: One Product Family, One Filler, One Door-to-Door Stream
The selected product family is a 1-litre premium tub line producing six SKUs on one filler.
This is an appropriate starting point because all six products share:
- The same tub format and case configuration
- The same filler, lid applicator and coding equipment
- A common mix, pasteurisation, ageing and freezing route
- Similar customer demand and dispatch requirements
- Meaningful variation in flavour, allergen profile, label and changeover sequence
Mapping the entire frozen dessert factory would blend together fundamentally different technologies, such as extrusion, moulding, novelty products and bulk filling. A focused family map produces more reliable data and clearer improvement priorities.
The door-to-door boundary is:
Start: mix batching and ingredient staging
Finish: palletised finished case available at the dispatch dock
The map includes material and information flow, but excludes upstream ingredient supplier operations and downstream customer distribution.
3. Current-State Value Stream Map: The Hardening Room Is the Visible Queue
The operating basis is:
- Customer demand: 48,000 tubs per week
- Available time: 4,500 productive minutes per week
- Available time in seconds: 4,500 × 60 = 270,000 seconds
- Takt time: 270,000 ÷ 48,000 = 5.625 seconds per tub
- Filler rate: 9,000 tubs per hour
- Average hardening-room dwell: 6.5 hours
- Hardening-room design target: 3 hours
- Allergen changeover: 95 minutes
- Allergen changeover target: 20 minutes
The following figures are realistic worked assumptions for a baseline map. They should be replaced with observed timestamps, production records and verified inventory counts.

| Process box | Direct cycle or dwell time | Changeover | Uptime | Batch size | WIP or inventory after step |
|---|---|---|---|---|---|
| 1. Mix batching and ingredient staging | 60 min batch; 8 min direct value-added time | 20 min | 92% | 1,000 kg | 1,500 tub equivalents |
| 2. Pasteurisation and homogenisation | 18 min batch | 15 min | 94% | 1,000 kg | 2,000 tubs |
| 3. Ageing tank | 5.2 hr average dwell | 10 min | 96% | 1,000 kg | 4,800 tubs |
| 4. Continuous freezing and aeration | 5 min batch equivalent | 25 min | 88% | 700 kg/hr | 1,800 tubs |
| 5. Filling, lid application and coding | 0.40 sec/tub at nominal rate | 95 min allergen | 82% | 8,000 tubs | 8,000 tubs |
| 6. Hardening room | 390 min average dwell | 30 min | 78% | 8,000 tubs | 12,000 tubs |
| 7. Metal detection, checkweigh and QA release | 0.45 sec/tub | 10 min | 95% | 8,000 tubs | 3,000 tubs |
| 8. Case packing | 1.20 sec/tub equivalent | 15 min | 90% | 8,000 tubs | 4,000 tubs |
| 9. Palletising | 4 min per pallet | 5 min | 93% | 32 cases/pallet | 3,500 tubs |
| 10. Frozen warehouse and dock staging | 4 min per pallet pick | – | 99% | Dispatch wave | 37,600 tubs |
Total mapped WIP is approximately 78,200 tub equivalents. At average demand of 48,000 tubs per week, or approximately 6,857 tubs per day:
78,200 ÷ 6,857 = 11.4 days of lead-time exposure
The direct value-added time is approximately 34 minutes:
- Mix batching: 8 minutes
- Pasteurisation and homogenisation: 4 minutes
- Continuous freezing: 5 minutes
- Filling and sealing: 10 minutes
- Hardening transformation touch time: 5 minutes
- Detection and checkweigh: 1 minute
- Case packing and palletising: 1 minute
Therefore:
Process cycle efficiency = Value-added time ÷ Total lead time
34 ÷ (11.4 × 24 × 60) × 100
34 ÷ 16,416 × 100 = 0.21%
The line is capable of producing tubs quickly, yet the product spends most of its time waiting, ageing, hardening, awaiting release or occupying frozen storage.
4. The Eight DOWNTIME Wastes in This Stream
The current-state map exposes a specific example of each Lean waste:
- Defects: Incorrect allergen labels or underweight tubs discovered after hardening, creating segregation and rework.
- Overproduction: Producing a full flavour campaign before confirmed demand, filling freezer locations with slow-moving tubs.
- Waiting: Filled tubs waiting for an available hardening-room slot for several hours.
- Non-utilisation of talent: Operators manually searching for tubs, labels and tools instead of improving standard work and changeover design.
- Transportation: Pallets moved from filler to temporary staging, then to hardening, then back through QA release and into storage.
- Inventory: 12,000 tubs accumulated around the hardening room and 37,600 tubs held in finished-goods storage.
- Motion: Sanitation and filler teams walking repeatedly to retrieve hoses, change parts, labels and allergen verification materials.
- Excess processing: Repeated post-hardening sampling and paperwork because nozzle-level checks and electronic batch records are not fully integrated.
5. Future-State Build: Create a Pull-Based Frozen Flow

The future state should connect improvement actions to practical process levers.
Sequence allergen families and apply SMED to the filler
Schedule products from lower allergen complexity to higher allergen complexity where validated and appropriate. Group similar labels, lids and flavour families to reduce unnecessary changeovers.
Use SMED to separate internal and external work:
- Prepare tools, parts, labels and cleaning materials before the run ends.
- Use quick-release connections and preset filler recipes.
- Move inspection and line-clearance preparation outside the downtime window.
- Standardise the first-good-tub verification.
The target is a reduction from 95 minutes to 20 minutes, subject to sanitation validation and food safety approval.
Use pull-based flavour scheduling
The filler becomes the pacemaker for the six-SKU family. A supermarket or controlled schedule should replenish only what downstream demand consumes. Production quantities should reflect confirmed demand, freezer capacity and shelf-life priorities rather than simply maximising batch size.
Enforce hardening-room slot discipline
Create visible, numbered hardening slots with:
- Product SKU and allergen profile
- Entry timestamp
- Required release time
- Core-temperature release criterion
- Responsible operator
The objective is to reduce average dwell from 6.5 hours to 3 hours, without compromising the product specification. The Tetra Pak Extrusion Tunnel A3 reference illustrates why tunnel configuration, air temperature, product design and residence time must be considered together.
Apply FEFO freezer slotting
Use first-expiry-first-out freezer locations. Slot products by SKU, lot, expiry date and dispatch frequency. This reduces search time, unnecessary pallet movements and ageing inventory.
Move quality checks toward the nozzle
Perform ice-cream-specific checks at the filler nozzle rather than relying mainly on post-hardening inspection. Examples include:
- Fill-weight trend and giveaway
- Product temperature
- Overrun or density
- Seal and lid placement
- Code and label verification
- Allergen and recipe confirmation
Retain validated post-process checks, including in-line metal detection. For allergen controls, the FDA food allergen guidance supports documented cleaning procedures, production sequencing, monitoring, verification and appropriate testing.
6. Current State Versus Future State
| KPI | Current state | Future state | Delta |
|---|---|---|---|
| Lead time | 11.4 days | 4.0 days | −7.4 days |
| Process cycle efficiency | 0.21% | 0.61% | +0.40 percentage points |
| WIP and finished inventory | 78,200 tubs | 33,600 tubs | −44,600 tubs |
| Allergen changeover | 95 min | 20 min | −75 min |
| Uptime/OEE | 68% | 82% | +14 percentage points |
| First pass yield | 96.2% | 99.2% | +3.0 percentage points |
| Inventory turns | 18 | 30 | +12 turns |
| On-time in full | 88% | 97% | +9 percentage points |
The future-state PCE assumes direct value-added time of approximately 35 minutes and lead time of 4.0 days:
35 ÷ (4 × 24 × 60) × 100 = 0.61%
The percentage remains modest because frozen dessert manufacturing contains necessary ageing and hardening residence. The improvement objective is not to eliminate valid processing time. It is to eliminate uncontrolled queues around that processing.
7. 90-Day Kaizen Sequencing

Days 1–30: Measure and stabilise
Owners: Value Stream Manager, Production Supervisor, QA Lead, Maintenance Lead
Tools:
- Time observation sheets
- 5S at the filler and sanitation areas
- Current-state value stream mapping
- Standard work combination sheets
- Hardening-room visual board
Expected movement:
- Establish reliable baseline data
- Reduce search and motion by 20%
- Reduce hardening-room average dwell from 6.5 to 5 hours
- Improve schedule adherence by 5 percentage points
Days 31–60: Run focused kaizen events
Owners: Filler Team Leader, Sanitation Supervisor, Scheduler, Quality Engineer
Tools:
- SMED kaizen event
- Allergen sequencing matrix
- Changeover video study
- Pull-based flavour schedule
- Nozzle-level quality checks
- FEFO freezer slotting
Expected movement:
- Reduce allergen changeover from 95 to 35 minutes
- Increase first pass yield from 96.2% to 98.5%
- Reduce hardening-room WIP by 30%
- Improve OEE to approximately 76%
Days 61–90: Lock in the future state
Owners: Operations Manager, Warehouse Manager, QA Manager, Continuous Improvement Lead
Tools:
- Standard work audits
- Visual management
- Daily tier meetings
- KPI control charts
- Error-proofed label and recipe verification
- Weekly kaizen review
Expected movement:
- Achieve the 20-minute allergen changeover target
- Stabilise hardening dwell near 3 hours
- Reach 82% OEE
- Achieve 99.2% first pass yield
- Lift OTIF toward 97%
8. Build Frozen-Food Improvement Capability
A successful frozen dessert value stream mapping project requires more than a diagram. Teams need the capability to measure flow, analyse variation, conduct SMED, interpret process data and sustain standard work.
Lean 6 Sigma Hub offers CSSC-accredited Lean Six Sigma training from White Belt through Green Belt and Black Belt:
- White Belt for foundational awareness and DMAIC understanding
- Yellow Belt for practical team support and improvement tools
- Green Belt for data-driven project leadership
- Black Belt for complex cross-functional transformation
Professionals in frozen foods can begin with a free practice test for the entry belts, then progress through self-paced case studies, worked examples, charts and project templates. Start your Lean Six Sigma certification journey today and apply the method to reduce hardening-room queues, shorten allergen changeovers and strengthen cold-chain flow.
Kaizen. Kai-Care. Kai-Done. Lean Six Sigma