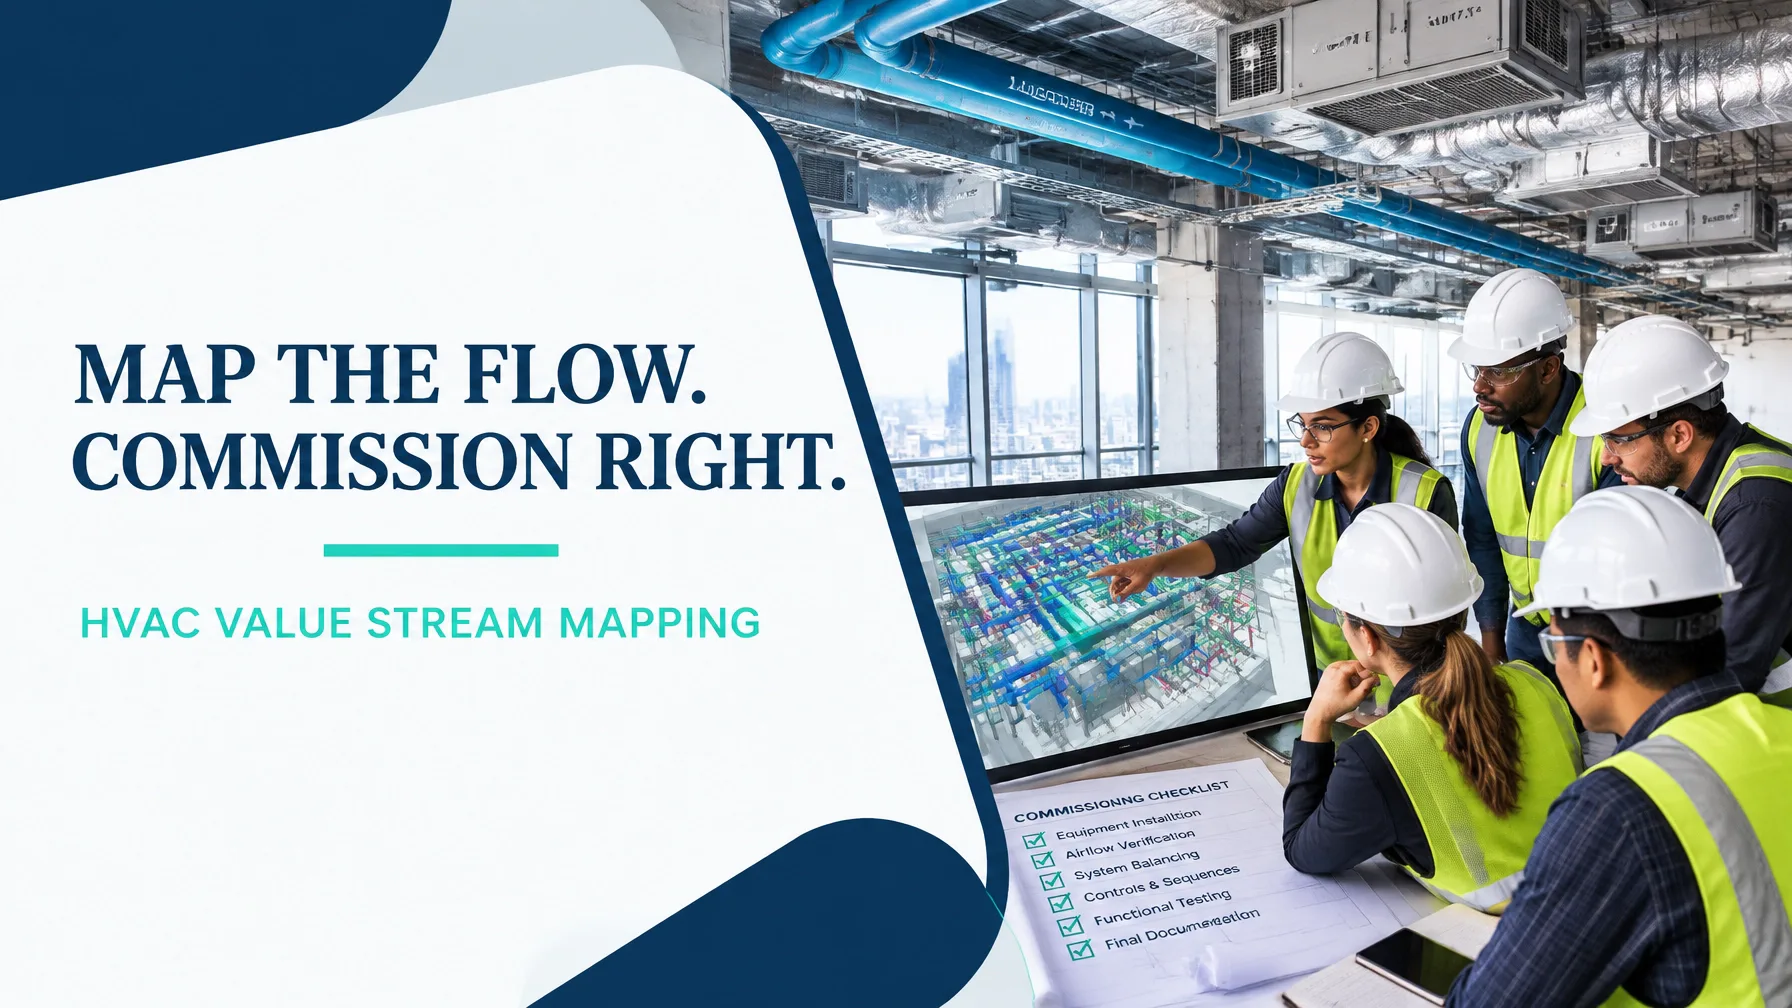
In the realm of mechanical services contracting, project performance is determined by more than installation speed. Design coordination, procurement approvals, site readiness, fabrication, access, trade sequencing, controls integration and commissioning must converge in the correct sequence.
This is precisely where value stream mapping becomes practical. Rather than viewing the programme as a collection of isolated activities, value stream mapping shows how information, materials, approvals and labour move from contract award to a commissioned, accepted system.
The fundamental purpose is to expose the difference between:
- Value-added time: work that transforms the system or verifies its performance.
- Necessary but non-value-added time: approvals, inspections and compliance activities required by the project.
- Avoidable non-value-added time: waiting, rework, searching, duplicate coordination and late defect discovery.
A construction value stream map is not a replacement for a detailed programme. It is a fact-based view of how the project actually flows.
For context, published MEP research has identified substantial non-value-added activity in mechanical installation, including waiting for work fronts, repeated routing corrections and tool or labour preparation. A useful supporting reference is the Value Stream Mapping in MEP Work study. The principles also align with Lean Six Sigma tools such as Process Cycle Efficiency, which measures how much elapsed time genuinely creates customer value.
1. Scope Selection: One HVAC Product Family and Clear Boundaries
To make the analysis actionable, select one repeatable product family rather than attempting to map every mechanical package simultaneously.
Product family
This worked example covers a mid-rise commercial chilled water and VAV fit-out comprising:
- A 12-storey commercial building
- Approximately 180 VAV terminal units
- Chilled water pipework, pumps, valves and controls
- Main supply and return ductwork
- BMS controls wiring and graphics
- Testing, adjusting and balancing
- Commissioning, handover and practical completion
Project basis
- Contract value: USD 2.4 million
- Planned programme: 22 weeks
- Shop drawings: 340
- Average drawing revision loops: 3
- Rework consumption: 14% of installed labour hours
- Average lift for plant approval: 26 days
- First-pass commissioning findings: 118 defects per 100 units
- First-pass commissioning yield: approximately 82%
- Defects close-out tail: 5.5 weeks
Start and end points
The value stream begins at:
Contract award and notice to proceed
It ends at:
Practical completion with commissioning sign-off, accepted test records, approved as-builts, O&M manuals and client handover
This boundary includes design information, materials, installation and commissioning. It excludes tendering before award and long-term facilities maintenance after handover.
2. Current-State Value Stream Map
The current-state value stream mapping exercise should be completed through a site walk involving the project manager, design coordinator, procurement lead, site supervisors, commissioning manager, controls contractor and client representative.
The map below uses illustrative but realistic project data. Process boxes may overlap in time, so their durations should not simply be added together.

| Process box | Observed condition | Value-added touch time |
|---|---|---|
| 1. Contract award and mobilisation | Scope review, responsibilities, programme alignment and mobilisation take approximately 5 working days | 0.2 days |
| 2. Design coordination | Mechanical, structural, architectural, electrical and fire interfaces are coordinated across multiple models | 0.6 days |
| 3. Shop drawing approval | 340 drawings experience an average of 3 revision loops; approval lift averages 26 days for plant-related information | 0.5 days |
| 4. Equipment procurement | Chillers, pumps, VAV boxes, dampers and controls require submittal approval, ordering and manufacturing | 0.4 days |
| 5. Ductwork fabrication | Fabrication proceeds while some coordination information remains subject to change | 0.8 days |
| 6. Site delivery and staging | Materials arrive by availability rather than by floor installation sequence | 0.2 days |
| 7. Riser installation | Crews install pipework, duct risers, supports, insulation and access provisions | 0.8 days |
| 8. VAV and terminal-unit installation | Approximately 180 units are installed, often with variable access and material availability | 1.2 days |
| 9. Controls wiring | Controllers, sensors, actuators and BMS cabling are installed and identified | 0.5 days |
| 10. Commissioning | Point-to-point checks, start-up, TAB and functional testing generate 118 first-pass findings per 100 units | 1.1 days |
| 11. Defects close-out and handover | Defects, documentation, witness testing and final sign-off create a 5.5-week tail | 0.2 days |
The total elapsed lead time is 110 working days, equivalent to the 22-week programme. The total value-added touch time is approximately 6.5 working days.
Therefore:
Process Cycle Efficiency = 6.5 ÷ 110 × 100 = 5.9%
This is approximately 6%, meaning that most elapsed time is consumed by queues, approvals, coordination, movement, inspection, rework or work-front constraints rather than direct transformation of the HVAC system.
The Lean Six Sigma Project Storyboard Toolkit provides a useful structure for documenting this baseline, including the current-state map, data collection plan, Pareto analysis, future-state map and control plan.
3. The Eight DOWNTIME Wastes on the Project
A value stream map becomes more useful when every delay is connected to a specific site reality.
1. Defects
Duct penetrations are discovered to clash with structural beams after installation begins. Sections must be modified, removed or re-fabricated.
2. Overproduction
Duct sections or supports are fabricated for a floor before the coordinated ceiling zone and builder’s-work openings are ready.
3. Waiting
A mechanical crew waits for plant approval, ceiling access, electrical containment or a released work front.
4. Non-utilised talent
Site supervisors spend time manually reconciling two coordination models instead of resolving constraints, coaching crews or improving installation methods.
5. Transportation
Ductwork and VAV units are moved from the loading area to temporary storage, then relocated again when the original floor is not ready.
6. Inventory
Excess fittings, dampers and partially installed assemblies occupy valuable floor and plant-room space, increasing search and handling time.
7. Motion
Installation teams walk multiple levels to locate valves, fittings, tools or missing controls components because materials are not staged by floor or zone.
8. Extra processing
The same coordination issue is marked up independently in two models, then transferred into separate trackers and meeting minutes.
The objective is not to assign blame. It is to understand how the system creates delay so that the team can redesign the flow.
4. Future-State Build: Design Once, Stage by Zone, Commission Progressively
The future-state value stream should be built around controlled release and short feedback loops.
Standard work for drawing issue and clash resolution
Create one standard process for:
- Model federation
- Clash detection
- Responsibility assignment
- Resolution due date
- Verification
- Approved issue
- Revision control
Every drawing should have a defined status, owner and next action. The target is to reduce the average revision loop from 3 to 1.5 or fewer.
Set-based design freeze
Do not freeze the entire project through one late-stage event. Freeze by floor or zone when the following conditions are met:
- Structural and architectural backgrounds are current
- Builders’ work openings are confirmed
- Equipment selections are approved
- Access and maintenance clearances are verified
- Controls interfaces are defined
- Installation materials are available or committed
Pull-based materials staging
Create floor-by-floor kits containing the duct sections, VAV units, supports, valves, fittings and controls accessories required for the next installation sequence.
A kit should be:
- Labelled by floor, zone and system
- Checked against the latest approved drawing
- Delivered close to the installation window
- Confirmed complete before the crew is released
Single-model federation
Use one coordinated model for mechanical, electrical, structural, architectural, fire and controls interfaces. This reduces duplicate mark-ups and gives every trade the same reference point.
In-line commissioning and progressive sign-off
Commissioning should begin during installation rather than at the end. Use progressive checks for:
- Pressure testing
- Duct leakage
- Flushing and cleaning
- Equipment alignment
- Valve access
- Sensor installation
- Point-to-point controls checks
- Air and water balancing
- Functional performance testing
Close defects by floor or zone. This prevents small issues from accumulating into a final-stage callback campaign.

5. Current State Versus Future State
The future-state values below are improvement targets for this worked example. They should be validated through a pilot zone before full rollout.
| Measure | Current state | Future state target | Delta |
|---|---|---|---|
| Total lead time | 110 working days / 22 weeks | 90 working days / 18 weeks | −20 days |
| Value-added ratio | 5.9% | 12.0% | +6.1 percentage points |
| First-pass commissioning yield | 82% | 95% | +13 percentage points |
| Shop drawing revision loops | 3.0 average | 1.5 average | −1.5 loops |
| Rework hours as percentage of labour | 14% | 6% | −8 percentage points |
| Defects close-out tail | 5.5 weeks | 2.0 weeks | −3.5 weeks |
| Labour productivity per unit installed | 11.0 hours/unit | 9.0 hours/unit | −2.0 hours/unit |
At 180 VAV units, reducing labour content by 2 hours per unit represents approximately 360 labour hours of released capacity. The financial benefit should then be validated through the project’s labour rates, avoided overtime, reduced subcontractor exposure and improved handover performance.
6. A 90-Day Kaizen Sequencing Plan
Improvement should be sequenced so that the team establishes control before introducing more advanced countermeasures.

Days 1–30: Establish the baseline and stabilise design release
Primary owners:
- Project manager
- Design manager
- BIM coordinator
- Commercial manager
- Commissioning manager
Actions:
- Walk the current state from award to handover.
- Validate drawing revision, approval and rework data.
- Create a constraint log for floors, plant rooms and risers.
- Define drawing status rules and approval responsibilities.
- Introduce design-freeze criteria by zone.
Target KPI movement:
- Reduce approval turnaround by 20%
- Increase first-time drawing approval to 70%
- Reduce uncontrolled revision loops from 3.0 to 2.2
Days 31–60: Install pull-based staging and progressive commissioning
Primary owners:
- Construction manager
- Logistics manager
- Mechanical superintendent
- Controls lead
- Commissioning manager
Actions:
- Pilot kits on two representative floors.
- Stage materials according to the next planned installation zone.
- Use daily readiness checks before releasing crews.
- Introduce floor-by-floor pressure, controls and installation checklists.
- Start progressive commissioning and zone sign-off.
Target KPI movement:
- Reduce material search and movement time by 30%
- Increase installation productivity from 11.0 to 9.8 hours per unit
- Increase first-pass commissioning yield from 82% to 90%
Days 61–90: Standardise, solve recurring defects and control the gain
Primary owners:
- Lean Six Sigma project lead
- Quality manager
- Project manager
- Trade supervisors
- Client commissioning representative
Actions:
- Document standard work for drawing issue, kitting and sign-off.
- Apply A3 problem solving to the top three defect modes.
- Use Pareto analysis to prioritise recurring commissioning findings.
- Create a control plan for revision loops, rework hours and zone acceptance.
- Review performance at weekly project governance meetings.
Target KPI movement:
- Reduce rework from 14% to 6% of labour hours
- Reach 95% first-pass commissioning yield
- Reduce defects close-out tail to 2 weeks
- Sustain value-added ratio at 12% or higher
Build the Capability to Lead Better Mechanical Services Projects
Value stream mapping is a powerful entry point, but the strongest results come when professionals can connect Lean principles to data analysis, root-cause validation, project governance and control planning.
For construction and mechanical services professionals:
- Green Belt training develops the ability to lead structured improvement projects, analyse process data, build current and future-state maps and deliver measurable results.
- Black Belt training prepares practitioners to lead complex, cross-functional transformation, mentor Green Belts and apply advanced statistical and problem-solving methods.
Lean 6 Sigma Hub provides CSSC-accredited online Lean Six Sigma training with self-paced lessons, real-world simulations, worked examples, charts, dummy data and end-to-end DMAIC case studies. Explore the Green Belt course or advance to Black Belt training to turn project observations into controlled, repeatable improvement.
Start your Lean Six Sigma certification journey today and learn to lead mechanical services projects from contract award to commissioning with stronger flow, clearer evidence and fewer callbacks.
Kaizen. Kai-Care. Kai-Done. Lean Six Sigma