Fuel Terminal Operations Are a Flow Business Disguised as a Throughput Business
In the realm of fuel distribution, monthly throughput is an important measure, but it does not explain the full cost of serving customers.
A terminal can move millions of litres while still carrying excessive waiting, repeated handling, avoidable re-sequencing and unreliable delivery timing. The gantry queue and available tank ullage often drive cost per litre and delivery reliability invisibly. When trucks wait for a loading slot, or when a receiving tank cannot accept a nominated product, the process continues to consume labour, equipment capacity, transport time and working capital without creating customer value.
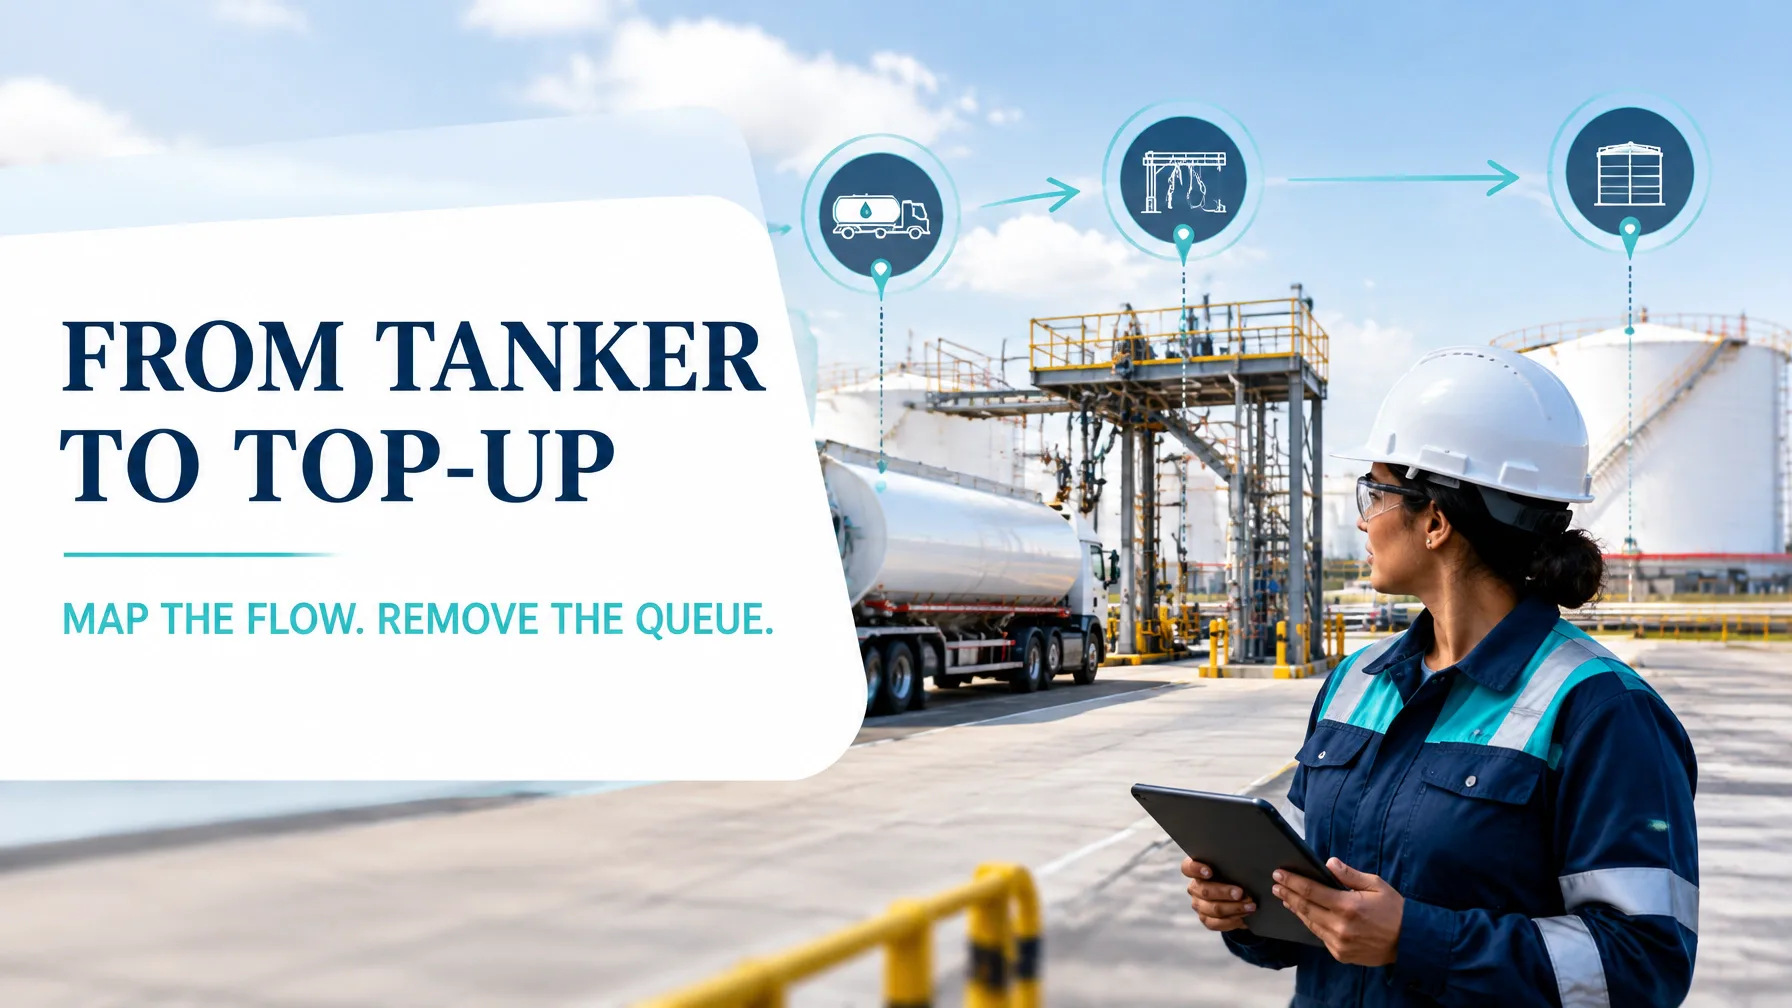
Value Stream Mapping (VSM) makes these hidden constraints visible. It connects the material flow, from tanker discharge to retail site replenishment, with the information flow of nominations, slot bookings, tank-level signals, route plans, proof of delivery and invoicing.
This guide develops a worked current-state and future-state map for a multi-product fuel terminal, using practical Lean Six Sigma measures and a 90-day kaizen sequence.
Scope Selection: One Product Family and a Defined Boundary
The selected product family is a multi-product fuel terminal distributing:
- Diesel
- 91 octane petrol
- 98 octane petrol
- Eight loading gantries
- 140 retail sites
- 60 wholesale customers
The process boundary begins at tanker discharge at the terminal and ends when the product is decanted into the customer site tank, electronically confirmed and released for invoicing.
The project excludes refinery production, long-term procurement contracting and retail forecourt sales. This boundary keeps the project sufficiently broad to expose flow constraints while remaining practical for a 90-day improvement programme.
The project CTQ requirement is:
Deliver the correct product and quantity to the correct site, within the agreed receiving window, with complete quality, safety and commercial records.
This is consistent with the Define Phase discipline described in our guide to scoping Lean Six Sigma projects.
Current-State Value Stream Map: Where 31 Hours Disappear
The operating baseline is:
- 32 ML per month distributed
- 210 tanker deliveries per month
- Gantry loading average: 34 minutes, against a 22-minute standard
- Peak driver wait for a gantry slot: 41 minutes average
- Mid-shift order re-sequencing: 6.2% of deliveries
- Tank farm ullage swings from 18% to 4% within one day
- Site stockouts: 3.1 per week
- Invoice disputes: 48 per month
- First-time-right delivery: 88%
- Nomination-to-site-top-up lead time: approximately 31 hours
The current-state map contains 11 process boxes:
| Process box | Typical observation |
|---|---|
| 1. Supply nomination and order sequencing | Nominations are released using forecast, manual priority decisions and available product information. |
| 2. Tanker arrival and weighbridge | Drivers complete gate, safety, identification and weight checks before entering the terminal flow. |
| 3. Pre-discharge quality sampling | Samples, documents and product compatibility are checked before discharge approval. |
| 4. Tanker discharge | Product is transferred into nominated tanks, with connection, pumping, measurement and close-out activities. |
| 5. Tank farm ullage management | Available capacity is checked across product-compatible tanks; ullage may move from 18% to 4% during a day. |
| 6. Additive dosing | Dosing instructions are confirmed and applied, with manual checks creating potential delay and variation. |
| 7. Gantry loading | Eight gantries load the tanker compartments; average cycle time is 34 minutes versus a 22-minute standard. |
| 8. Driver dispatch | Dispatch documentation, vehicle release and route instructions are completed. |
| 9. Route delivery | Trucks travel to retail and wholesale customers, sometimes requiring changes when receiving conditions differ from plan. |
| 10. Site decant | Product is transferred into the site tank after access, tank identity, ullage and product checks. |
| 11. Electronic proof of delivery and invoicing | Delivery confirmation is captured, reconciled and passed to invoicing; the process generates 48 disputes per month. |
A representative lead-time calculation is:
- Value-added time: 150 minutes
- Non-value-added time: 1,710 minutes
- Total elapsed time: 1,860 minutes, or 31 hours
- Process Cycle Efficiency: 150 ÷ 1,860 × 100 = 8.1%
The Process Cycle Efficiency Calculator defines PCE as the proportion of total lead time spent on work that creates customer value. Here, approximately 92% of elapsed time is waiting, movement, inspection, queueing, administrative handling or rework.

The Eight DOWNTIME Wastes in This Fuel Stream
The current-state map shows a specific example of each of the eight Lean wastes:
- Defects: A tanker is loaded with the wrong grade or receives an incorrect additive dose, requiring investigation and corrective delivery.
- Overproduction: Product is dispatched before the site’s actual tank-level requirement is confirmed, creating excess inventory at the receiving location.
- Waiting: A driver waits an average of 41 minutes for a gantry slot during peak periods.
- Non-utilised talent: Experienced drivers and operators spend time resolving avoidable paperwork and manually reconciling duplicate information.
- Transportation: A route is changed because a site cannot accept the load during the planned receiving window.
- Inventory: Tank farm ullage falls to 4%, restricting discharge flexibility and increasing the risk of urgent rescheduling.
- Motion: Operators move between gantry controls, paper records, sampling points and dispatch offices to complete one loading transaction.
- Excess processing: Compliance information is entered repeatedly across manual forms, spreadsheets and invoicing records.
The purpose of identifying waste is not to criticise individuals. It is to redesign the system so that trained people can spend more time managing flow, quality, safety and customer reliability.
Future-State Build: Pull Replenishment and Levelled Gantry Flow
The future-state map should connect customer demand, tank capacity and terminal execution through one disciplined flow:
- Use tank telemetry to create a pull signal. Site tank levels, demand rates and minimum operating levels trigger replenishment based on actual consumption rather than periodic manual requests alone.
- Book delivery slots before dispatch. A levelled gantry schedule distributes work across eight gantries and protects the receiving site’s delivery window.
- Complete pre-load quality and additive checks. Product grade, compartment assignment, additive requirement and vehicle compatibility are confirmed before the tanker reaches the loading point.
- Apply automated sequencing rules. Orders are sequenced using route density, site ullage, product compatibility, customer priority and tanker configuration.
- Create a controlled dispatch release. The driver receives one digital instruction set containing route, product, quantity, site window and exception rules.
- Capture digital proof of delivery in the cab. Quantity, compartment, site, time, signatures and exceptions flow directly into invoicing.
- Manage the terminal through a daily flow board. Gantry cycle time becomes the lead metric, supported by driver wait, first-time-right delivery, stockouts and invoice accuracy.
The future state must preserve safety, grounding, overfill prevention, vapour controls, quality release and emergency response requirements. Lean improvement accelerates compliant flow; it does not remove critical control gates.

Current State Versus Future State
The following targets are practical improvement objectives for the 90-day pilot. They should be validated against timestamped operational data during Measure.
| Metric | Current state | Future state | Delta |
|---|---|---|---|
| Gantry cycle time | 34 min | 22 min | −12 min / −35% |
| Peak driver wait | 41 min | 10 min | −31 min / −76% |
| First-time-right delivery | 88% | 97% | +9 percentage points |
| Site stockouts | 3.1/week | 0.8/week | −2.3/week / −74% |
| Invoice disputes | 48/month | 10/month | −38/month / −79% |
| Nomination-to-site top-up lead time | 31 h | 18 h | −13 h / −42% |
| Tanker turns | 53/week | 60/week | +7/week / +13% |
| Cost per litre distributed | A$0.084/L | A$0.071/L | −A$0.013/L / −15% |
A reduction of A$0.013 per litre across 32 ML per month represents a theoretical monthly distribution-cost opportunity of approximately A$416,000, before implementation costs and changes in demand are considered.
90-Day Kaizen Sequencing
A disciplined sequence prevents the team from automating an unstable process.
Days 1–30: Establish the Baseline
Owners: Terminal flow manager, Lean Six Sigma Green Belt, gantry supervisor, transport planner and finance analyst.
Actions:
- Conduct time observation at each gantry.
- Capture arrival, slot booking, loading start, loading finish and dispatch timestamps.
- Establish the baseline for cycle time, driver wait and tanker turns.
- Analyse tank ullage trends by product, tank, shift and day.
- Confirm the relationship between site tank levels, emergency orders and stockouts.
Target KPI movement:
- 95% timestamp completeness
- Gantry cycle-time baseline by bay
- Ullage visibility for at least 90% of active tanks
- Root-cause Pareto for the 41-minute peak wait
Days 31–60: Pilot the Pull and Standard Work
Owners: Operations manager, quality manager, digital systems lead, route-planning lead and selected site managers.
Actions:
- Introduce SMED-style gantry standard work to separate internal and external preparation.
- Trial telemetry-driven replenishment across 20 retail sites.
- Create route-density rules that group deliveries by geography, receiving window and product compatibility.
- Standardise pre-load quality, additive and compartment checks.
- Measure the effect of slot discipline on re-sequencing.
Target KPI movement:
- Gantry cycle time reduced from 34 to 27 minutes
- Peak driver wait reduced from 41 to 22 minutes
- Mid-shift re-sequencing reduced from 6.2% to below 3%
- Pilot-site stockouts reduced by at least 40%
Days 61–90: Scale, Control and Audit
Owners: Terminal manager, IT product owner, finance controller, Master Black Belt sponsor and process owners.
Actions:
- Roll out slot booking across all eight gantries.
- Connect digital proof of delivery directly to invoicing.
- Establish automated exception alerts for low ullage, late arrival, quality hold and likely stockout.
- Create a control plan for cycle time, first-time-right delivery, invoice disputes and site availability.
- Audit the daily flow board at the start of every operating day.
Target KPI movement:
- Gantry cycle time at or below 22 minutes
- First-time-right delivery at 97%
- Invoice disputes at 10 or fewer per month
- Lead time at 18 hours or less
- PCE increased from 8.1% toward 14–16%

Build the Capability to Convert Flow Gains into Margin
Value Stream Mapping is the starting point. Sustained improvement requires the ability to define CTQs, measure reliable data, analyse root causes, design controlled countermeasures and maintain the gain through visual management and statistical control.
For terminal, transport and energy supply chain professionals, Lean Six Sigma certification provides a structured development path:
- White Belt: Understand foundational Lean Six Sigma principles and DMAIC awareness.
- Yellow Belt: Support improvement teams, collect process data and apply essential tools.
- Green Belt: Lead data-driven projects involving flow, capacity, reliability and customer delivery.
- Black Belt: Lead complex cross-functional transformations and mentor improvement teams.
Pursue Lean Six Sigma certification from White Belt through Black Belt with Lean 6 Sigma Hub to turn terminal flow improvements into measurable cost, capacity and margin results. Explore the CSSC-accredited, self-paced training pathway at Lean Six Sigma Online Training.
Kaizen. Kai-Care. Kai-Done. Lean Six Sigma