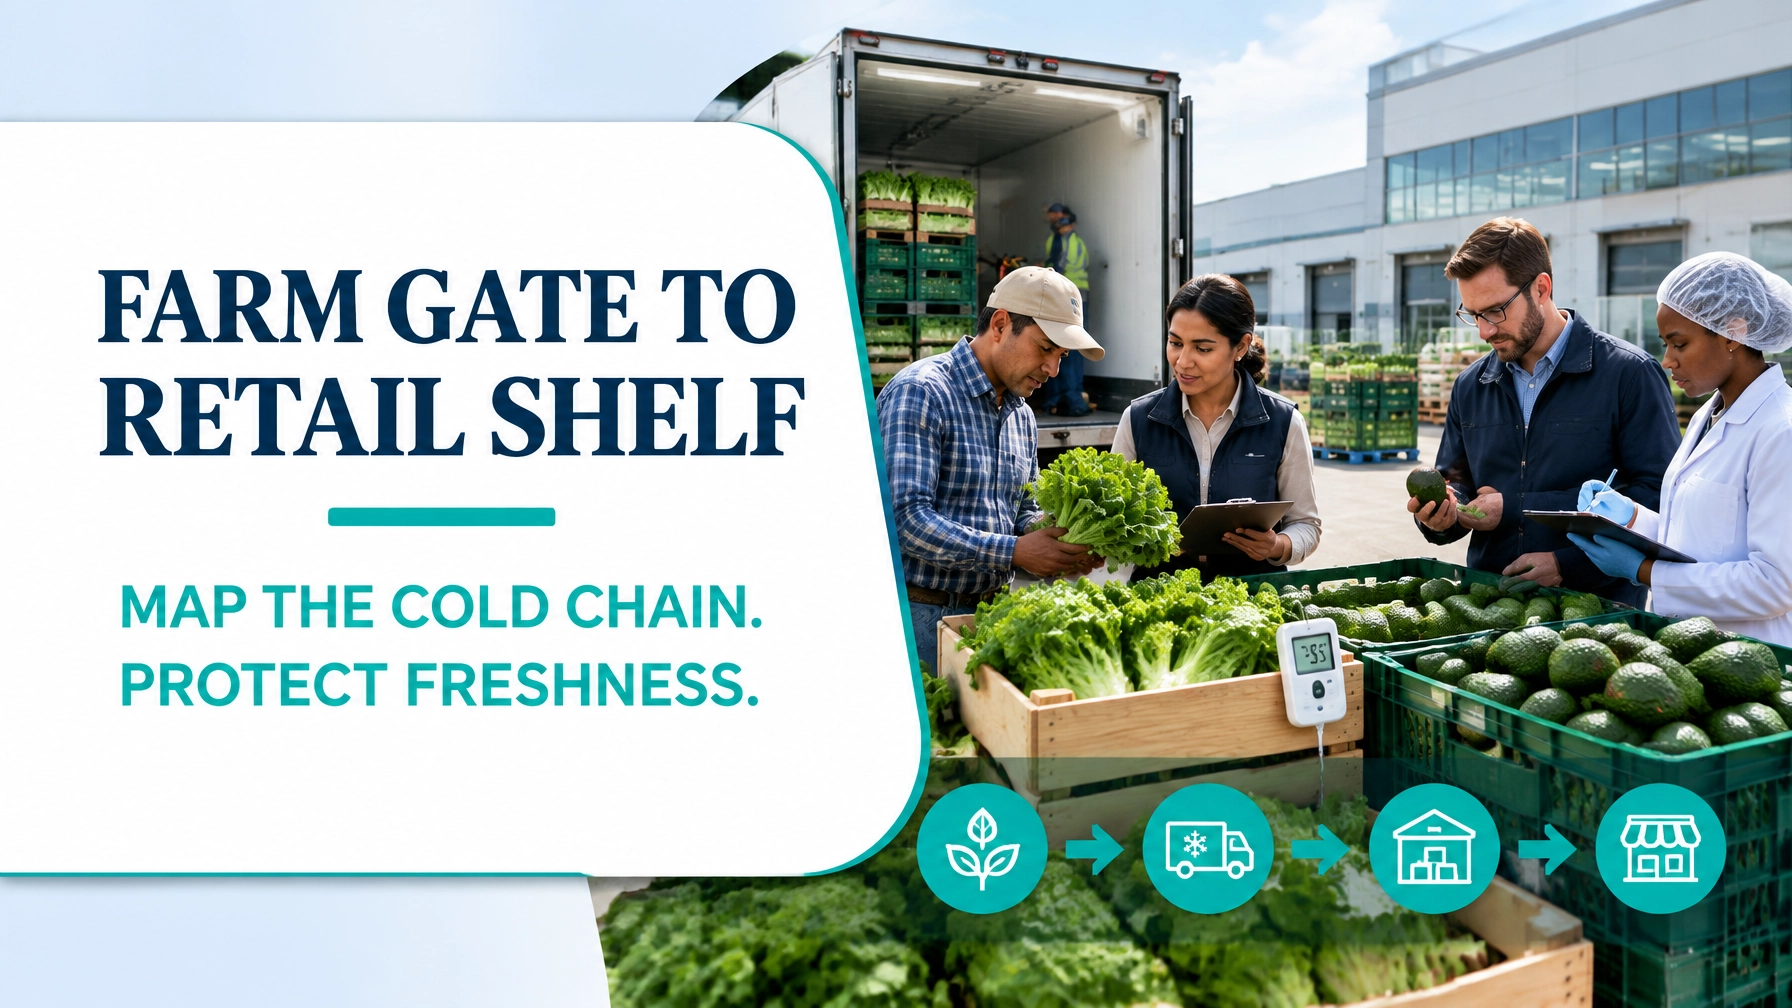
In fresh produce, every hour between harvest and retail matters. A crate of leafy greens can be perfectly saleable at the farm gate yet arrive at the store with reduced shelf life, quality concerns, or a high probability of disposal.
Value Stream Mapping (VSM) provides a structured way to see the complete flow of material, information, time, inventory, temperature, and quality from harvest to shelf. Instead of reviewing isolated warehouse or transport metrics, the team can identify how delays at one node create shrink several steps later.
This deep guide presents a worked example for a fresh-produce supply chain, including current-state data, DOWNTIME waste, temperature excursions, takt time, inventory, and a future-state improvement plan.
For additional context, see our guides on cold chain logistics and value-added versus non-value-added analysis.
1. Select the Value Stream and Define the Objective
The first VSM decision is the scope. Mapping an entire agricultural network can create excessive complexity, so begin with one product family, one lane, and one customer requirement.
Worked-example scope
- Product family: Bagged leafy greens
- Volume: 10,000 cartons harvested per day
- Customer demand: 8,640 cartons per day
- Route: Farm gate → packing house → cold-chain transport → distribution centre → retail store
- Temperature target: 2°C–5°C after pre-cooling
- Initial marketable life: 7 days from harvest
- Primary CTQs: Freshness, delivery timing, temperature compliance, carton availability, and remaining shelf life
The improvement objective is to reduce farm-to-retail lead time, temperature excursions, and cumulative shrink while maintaining the required retail service level.
The map should include both:
- Material flow: Harvest, packing, cooling, staging, transport, cross-docking, storage, and shelf replenishment.
- Information flow: Demand forecasts, harvest release, packing schedules, temperature alerts, quality approvals, FEFO instructions, and store orders.
The fundamental purpose of the map is to connect information decisions to physical outcomes. For example, a late order change can create additional staging time, while a delayed quality release can consume an entire day of shelf life.
2. Calculate Takt Time and Establish the Baseline
The operation has 12 effective packing hours available per day:
[
\text{Takt Time} = \frac{\text{Available Time}}{\text{Customer Demand}}
]
[
\text{Takt Time} = \frac{43,200\text{ seconds}}{8,640\text{ cartons}} = 5.0\text{ seconds per carton}
]
The packing line currently operates at an average 6.2 seconds per carton, which is slower than the required takt. This creates a queue before packing and encourages larger batch releases into cold staging.
The current process also shows:
- 10,000 cartons harvested
- 9,130 cartons reaching the retail shelf
- 8.7% cumulative shrink or downgrade
- 12,900 cartons in process or storage
- Four temperature excursions per day
- 3 hours 10 minutes of cumulative excursion time
- 43 hours farm-to-shelf lead time
- 3.1 days of remaining shelf life at store receipt

3. Build the Current-State Map
A practical current-state map should record the time and condition of the product at each node.
| Process step | Elapsed time | Active cycle or process time | Waiting/dwell | Current observation |
|---|---|---|---|---|
| Harvest and field collection | 6.0 h | 6.0 h | : | Product exposed to field conditions |
| Field shade staging | 2.0 h | : | 2.0 h | Average product temperature rises above target |
| Sorting and packing | 3.0 h | 3.0 h | 1.5 h queue included in batch release | Cycle time: 6.2 sec/carton |
| Pre-cooling | 2.5 h | 2.5 h | : | Cooling occurs in large batches |
| Cold-chain staging | 4.0 h | : | 4.0 h | Pallets wait for dispatch window |
| Farm-to-DC transport | 8.0 h | 6.5 h travel | 1.5 h loading and dispatch delay | One excursion during loading |
| DC receiving and cross-dock | 5.0 h | 1.0 h | 4.0 h | Quality release and dock congestion |
| DC-to-store transport | 4.0 h | 3.0 h travel | 1.0 h | Mixed-load route increases dwell |
| Store backroom | 8.0 h | 0.5 h handling | 7.5 h | Replenishment performed in large batches |
| Retail shelf replenishment | 0.5 h | 0.5 h | : | FEFO applied inconsistently |
Total elapsed time is approximately 43 hours. Active process and movement time is approximately 22.5 hours, producing a flow activity ratio of:
[
\frac{22.5}{43} \times 100 = 52.3%
]
This ratio does not mean all active time is customer value-added. Transport and inspection are often necessary business activities, but they do not physically transform the product. The calculation simply shows that nearly half of the total lead time is consumed by waiting or unproductive dwell.
Where does the shrink occur?
| Location | Primary loss mechanism | Estimated loss |
|---|---|---|
| Field and shade staging | Heat exposure and handling damage | 1.5% |
| Packing house | Trim loss, bruising, and rework | 2.0% |
| Farm-to-DC transport | Temperature variation and pallet damage | 1.0% |
| DC receiving and storage | Delayed release and ageing | 2.0% |
| Retail backroom and shelf | Late replenishment and reduced freshness | 2.2% |
| Cumulative outcome | : | 8.7% |
Temperature data shows the most significant exposure points are field staging, loading bays, DC receiving, and store receiving. These are not necessarily the longest process steps, but they are high-risk handoff points.
4. Identify DOWNTIME Waste in the Fresh Produce Flow
The eight DOWNTIME wastes provide a practical diagnostic lens.
- Defects: Bruised leaves, damaged cartons, wilted product, incorrect labels, and temperature-related quality failures.
- Overproduction: Harvesting or packing beyond confirmed demand, creating avoidable ageing and markdowns.
- Waiting: Pallets waiting for pre-cooling, dispatch, quality approval, dock allocation, or store replenishment.
- Non-utilized talent: Farm workers, drivers, quality staff, and store associates unable to resolve recurring issues because data is not visible at the point of work.
- Transportation: Multiple transfers between field, packing, staging, DC, and store without a clearly synchronized route.
- Inventory: Excess cartons in cold staging, DC storage, and retail backrooms consuming shelf life.
- Motion: Repeated pallet searches, manual temperature checks, long walks to scanners, and unnecessary handling.
- Excess processing: Duplicate inspections, repeated data entry, repacking, and approvals that do not change the release decision.
The Analyse phase should now test which causes have the strongest relationship with shrink. A useful starting point is to compare shrink by shift, route, dock, supplier, temperature excursion, and dwell-time band.
5. Design the Future-State Value Stream
The future state should not simply accelerate every process. It should create a more reliable pull-based flow that protects product condition.
Key design changes include:
- Harvest to demand signal: Release harvest quantities from store and DC demand rather than relying solely on a weekly forecast.
- Immediate field cooling: Move harvested cartons to shade and pre-cooling within 30 minutes.
- Pacemaker process: Use the packing line as the pacemaker, balancing staffing and equipment to a cycle time of 4.8 seconds per carton, below the 5-second takt.
- Smaller cold-chain batches: Replace four-hour staging windows with scheduled 60-minute dispatch windows.
- Cross-dock by default: Route compliant product directly from inbound to outbound lanes, using cold storage only for controlled exceptions.
- Temperature escalation: Configure real-time alerts for excursions exceeding 10 minutes, with clear hold, release, reroute, or accelerated-sale rules.
- FEFO discipline: Apply first-expired, first-out rules at the DC and retail backroom.
- Daily control board: Review shrink, dwell, temperature compliance, remaining shelf life, and on-time dispatch at every shift handover.

6. Current-State Versus Future-State Results
The following table shows the expected performance of the redesigned flow. These are illustrative worked-example figures that should be validated through local measurement.
| Metric | Current state | Future state | Improvement |
|---|---|---|---|
| Farm-to-shelf lead time | 43 h | 27 h | 37.2% reduction |
| Active process and movement time | 22.5 h | 19.7 h | 12.4% reduction |
| Flow activity ratio | 52.3% | 72.9% | +20.6 percentage points |
| Packing cycle time | 6.2 sec/carton | 4.8 sec/carton | Below takt |
| Takt time | 5.0 sec/carton | 5.0 sec/carton | Maintained |
| In-process inventory | 12,900 cartons | 6,800 cartons | 47.3% reduction |
| Temperature excursions | 4 per day | 1 per day | 75% reduction |
| Excursion duration | 190 min/day | 22 min/day | 88.4% reduction |
| Cumulative shrink | 8.7% | 4.0% | 4.7 percentage-point reduction |
| Cartons reaching shelf | 9,130 | 9,600 | 5.1% increase |
| Shelf life at store receipt | 3.1 days | 4.4 days | +1.3 days |
| Shelf life available at retail | 2.0 days | 3.4 days | +1.4 days |
The future state improves throughput without relying on additional inventory. More cartons reach the shelf because the process protects yield and removes time from non-value-adding queues.
7. Prioritized Kaizen Sequencing

A disciplined implementation sequence prevents the organization from introducing technology before stabilizing the process.
-
Kaizen Event 1 : Protect the first 30 minutes
Establish field shade, standardized harvest containers, and a maximum 30-minute transfer-to-cooling rule. -
Kaizen Event 2 : Rebalance packing to takt
Measure each packing element using a time observation sheet, remove unnecessary motion, and reduce cycle time from 6.2 to 4.8 seconds per carton. -
Kaizen Event 3 : Reduce cold-staging dwell
Introduce fixed dispatch windows, visual lane status, and a maximum 60-minute staging standard. -
Kaizen Event 4 : Stabilize cross-dock flow
Pre-assign receiving doors, separate compliant and exception pallets, and establish a two-hour cross-dock target. -
Kaizen Event 5 : Control temperature excursions
Use calibrated data loggers, real-time alerts, and a documented response plan for every excursion. -
Kaizen Event 6 : Implement FEFO at retail
Apply shelf-life labels, scan-based replenishment, and daily backroom ageing checks. -
Kaizen Event 7 : Sustain the gains
Add weekly VSM reviews, control charts for shrink and temperature, and monthly audits of lead time, WIP, yield, and shelf-life performance.
Conclusion: Map the Flow, Protect the Product
Fresh produce shrink is rarely caused by one isolated activity. It is usually the cumulative result of small delays, uncontrolled handoffs, excess inventory, inconsistent cooling, and information arriving after the physical decision has already been made.
Value Stream Mapping makes those relationships visible. By combining lead-time analysis with takt time, temperature data, inventory levels, DOWNTIME classification, and shelf-life measures, agriculture and logistics teams can move from broad concern to targeted action.
Pursue Lean Six Sigma certification with Lean 6 Sigma Hub to learn how to map complex value streams, analyse root causes, lead Kaizen events, and deliver measurable improvements across fresh-produce and cold-chain operations. Explore Lean Six Sigma training and certification and build practical capability through self-paced, data-driven learning.
Kaizen. Kai-Care. Kai-Done. ( Lean Six Sigma)