

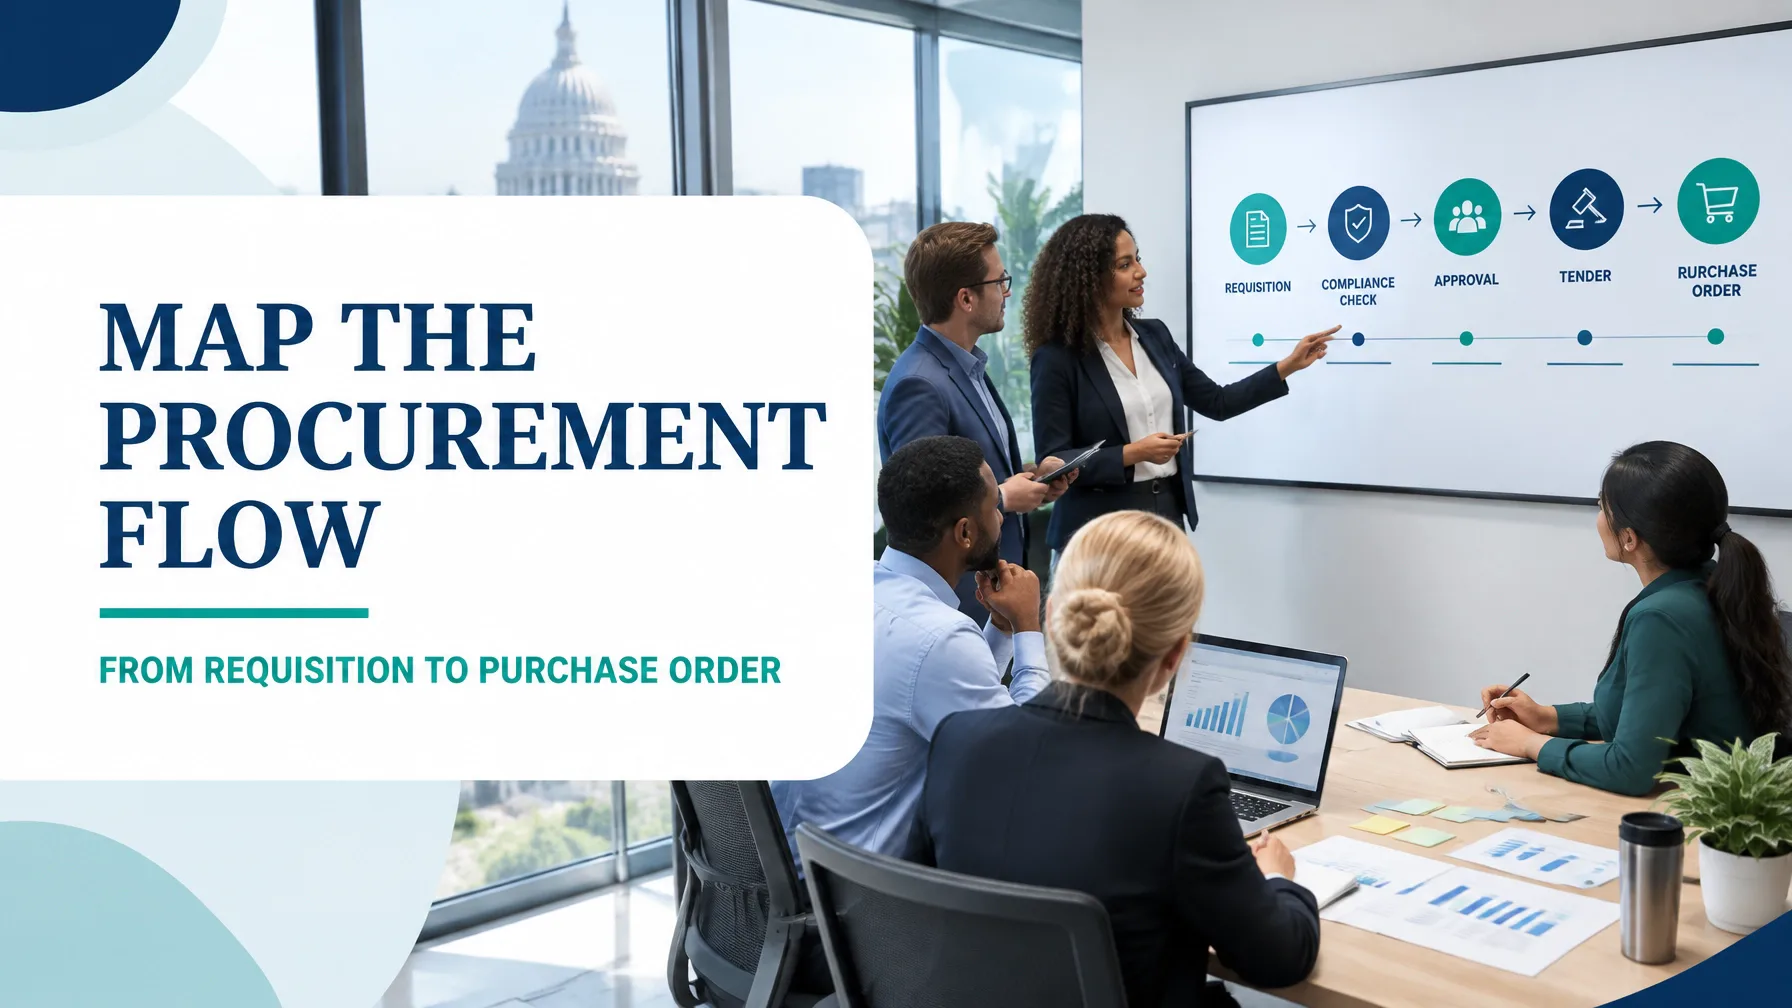
In public sector procurement, governance is essential. Every purchase must demonstrate transparency, appropriate authority, budget control, fairness and auditability. However, governance-heavy processes can also accumulate queues, repeated reviews and unclear handoffs.
Value stream mapping provides a disciplined way to see the entire procurement flow, not just the individual activities performed by procurement, finance, legal or business units. By mapping information, approvals, documents and waiting time from requisition to purchase order, leaders can preserve necessary controls while improving responsiveness.
This deep guide uses an illustrative public sector procurement process to show how to measure the current state, identify the eight DOWNTIME wastes and design a risk-tiered future state.
1. Define the procurement value stream and boundaries
The fundamental purpose of value stream mapping is to understand how value moves through an end-to-end process. In procurement, the output is not simply a completed form. It is an accurate, compliant and authorised purchase order issued within a predictable service level.
Scope selected for this example
- Product family: Routine goods and services requiring competitive procurement above the organisation’s quoting threshold
- Start point: A business unit submits a purchase requisition
- End point: An approved purchase order is issued to the supplier
- Excluded: Emergency procurement, major capital projects, construction, complex strategic sourcing and contract performance management
- Customers: Internal requesters, budget owners, suppliers, service users and the broader public
This boundary prevents the map from combining fundamentally different procurement routes. It also creates a manageable improvement project aligned with DMAIC: Define the process clearly, Measure its performance, Analyse causes, Improve the flow and Control the results.
2. Current-state map: where the working days go
The following data represents an illustrative sample of 120 requisitions reviewed over a three-month period. It is designed to demonstrate the method; each organisation should replace these values with its own transaction data.

| Process step | Average touch time | Average queue time | Typical issue |
|---|---|---|---|
| Requisition preparation and submission | 35 min | 1.5 days | Scope and cost information vary |
| Procurement intake and compliance triage | 55 min | 2.0 days | Missing attachments and coding errors |
| Budget confirmation | 45 min | 3.5 days | Sequential finance review |
| Clarification and specification refinement | 155 min | 4.0 days | Clarification loops with the requester |
| Market approach and quotation activity | 210 min | 6.0 days | Work starts before all information is stable |
| Evaluation and recommendation | 260 min | 5.0 days | Committee scheduling and document collation |
| Legal, finance and delegated approval | 110 min | 5.5 days | Average of 1.4 approval loops |
| Purchase order creation and release | 35 min | 2.0 days | Manual lookups and final checks |
| Total | 905 min | 29.5 days | 31.4 working days total lead time |
The arithmetic is straightforward:
- Touch time: 905 minutes, or approximately 1.89 working days
- Queue time: 29.5 working days
- Total lead time: 31.4 working days
- First-pass yield of compliant requisitions: 58%
- Average approval loops: 1.4
- Value-added time: 420 minutes
- Process Cycle Efficiency (PCE): 420 ÷ 15,072 minutes = 2.8%
The PCE calculation uses the total elapsed time of 31.4 working days multiplied by an eight-hour working day. Only 2.8% of the elapsed time is classified as value-added work in this example. The remaining time is waiting, rework, movement, checking or other necessary non-value-added activity.
This does not imply that compliance work lacks importance. Rather, it shows that the process has an opportunity to deliver the same control outcome with a more deliberate flow.
3. Identify the eight DOWNTIME wastes
A current-state map becomes useful when it connects time data to observable causes. In this procurement flow, the eight Lean wastes appear as follows:
- Defects: Non-compliant submissions, missing documentation, incorrect account codes and incomplete specifications create rework.
- Overproduction: Over-specified scopes and unnecessary reports generate information that does not improve the purchasing decision.
- Waiting: Approval queues, clarification rounds, committee scheduling and sequential budget checks extend lead time.
- Non-utilisation of talent: Category specialists spend time chasing paperwork instead of applying market knowledge and sourcing expertise.
- Transportation: Requisitions, evaluation reports and approvals move between business units, procurement, legal and finance through multiple handoffs.
- Inventory: The requisition backlog becomes work in process waiting in shared inboxes, queues and approval lists.
- Motion: Staff perform manual lookups across procurement, finance, contract and supplier systems.
- Excess processing: Duplicate approvals, layered sign-offs and repeated data entry add effort without proportionate risk reduction.
A useful supporting measure is first-pass yield. If 58 out of 100 requisitions are compliant on their first submission, then 42 require correction or clarification before the intended flow can continue. Improving the quality of the input is often more effective than adding capacity later in the process.
4. Build the future state around risk and flow
The future-state map should not remove controls indiscriminately. It should match the intensity of governance to the level of risk, value, complexity and market sensitivity.

Risk-tiered approval routes
- Low-risk route: Standard catalogue item, known supplier category, clear specification and low complexity. One delegated approval and automated compliance checks.
- Medium-risk route: Competitive quotation, moderate value or service complexity. Procurement review, budget confirmation and one formal recommendation approval.
- High-risk route: Sensitive data, material operational risk, unusual commercial terms or significant public interest. Full legal, finance and executive governance.
Standard work and visual control
The future state should include:
- A standard requisition template with mandatory fields
- A definition of “ready for procurement”
- Embedded document and coding checklists
- A single digital record for the requisition and approval history
- A Kanban-style board showing Ready, In Review, Awaiting Requester, Awaiting Approval and PO Issued
- Clear ownership for every queue
- Escalation rules when a service-level target is approaching
In this setting, takt time is best interpreted as a service rhythm. If the team receives 20 complete requisitions per day and has 40 available staff-hours, the planning takt is 2 staff-hours per requisition. This does not mean every procurement has identical touch time; it establishes a capacity signal for workload planning.
Suggested service-level takt by risk tier:
| Route | Target service level | Governance design |
|---|---|---|
| Low risk | PO within 5 working days | Standard template and delegated approval |
| Medium risk | PO within 10 working days | Procurement and budget review |
| High risk | PO within 15 working days | Full risk-based governance route |
5. Current versus future performance
The following future-state figures assume a 90-day pilot focused on routine goods and services.
| Metric | Current state | Future-state target | Improvement |
|---|---|---|---|
| Total lead time | 31.4 working days | 11.4 working days | 63.7% reduction |
| Touch time | 905 min | 650 min | 28.2% reduction |
| Queue time | 29.5 days | 10.0 days | 66.1% reduction |
| First-pass yield | 58% | 90% | +32 percentage points |
| Approval loops | 1.4 average | 0.5 average | 64.3% reduction |
| Value-added time | 420 min | 390 min | More focused work |
| Process Cycle Efficiency | 2.8% | 7.2% | 2.6 times higher |
| SLA attainment | 46% | 90% | +44 percentage points |
The objective is not merely to reduce the number of approvals. It is to create faster, clearer and more proportionate governance. A high-risk procurement should retain robust review. A low-risk, well-specified purchase should not wait in the same route as a complex strategic engagement.
For a practical calculation of PCE, use the Process Cycle Efficiency Calculator and enter observed touch and waiting times for each step.
6. A 90-day kaizen sequence
A staged kaizen approach creates momentum while protecting operational continuity.
Days 1–30: Stabilise the input
Owners: Procurement Operations Manager, business-unit representatives and finance process owner
Actions:
- Confirm the product family and baseline measures
- Introduce the standard requisition template
- Define “ready for procurement”
- Create a visible backlog and queue-age report
- Train requesters on common documentation and coding requirements
Targets:
- First-pass yield from 58% to 80%
- Requisition queue reduced to two working days
- 100% of requests assigned a visible owner
Days 31–60: Simplify the flow
Owners: Category Manager, delegated approval owner, legal representative and digital workflow owner
Actions:
- Pilot low-, medium- and high-risk approval routes
- Remove duplicate data entry
- Set approval service levels
- Create standard work for clarification and evaluation
- Introduce daily exception review for ageing requisitions
Targets:
- Lead time reduced from 31.4 to 16 working days
- Approval loops reduced from 1.4 to 0.8
- At least 85% of transactions routed correctly on first triage
Days 61–90: Control and scale
Owners: Lean Six Sigma project lead, procurement governance board and PMO
Actions:
- Validate the future-state results against the baseline
- Use run charts to monitor lead time, first-pass yield and SLA attainment
- Audit risk-tier decisions for consistency
- Document the control plan and escalation rules
- Extend the model to a second high-volume procurement family
Targets:
- Stable lead time at or below 11.4 working days
- First-pass yield at 90% or higher
- SLA attainment at 90%
- PCE at or above 7.2%
- No reduction in mandatory compliance controls
7. Develop the capability to lead the change
Value stream mapping is most powerful when teams can connect visual process analysis with data, root-cause analysis and governance design. A Yellow Belt can support mapping workshops and frontline data collection. A Green Belt can lead the DMAIC project, analyse variation and manage the improvement plan. A Black Belt can coordinate complex cross-functional change and mentor improvement teams.
Lean 6 Sigma Hub’s CSSC-accredited online training provides self-paced learning with practical case studies, tools and worked examples. Professionals ready to lead a project can explore the Lean Six Sigma Green Belt course, while experienced improvement leaders can progress to Black Belt training.
Start your Lean Six Sigma certification journey today and build the capability to map, improve and control governance-heavy processes with confidence.
Kaizen. Kai-Care. Kai-Done. Lean Six Sigma





