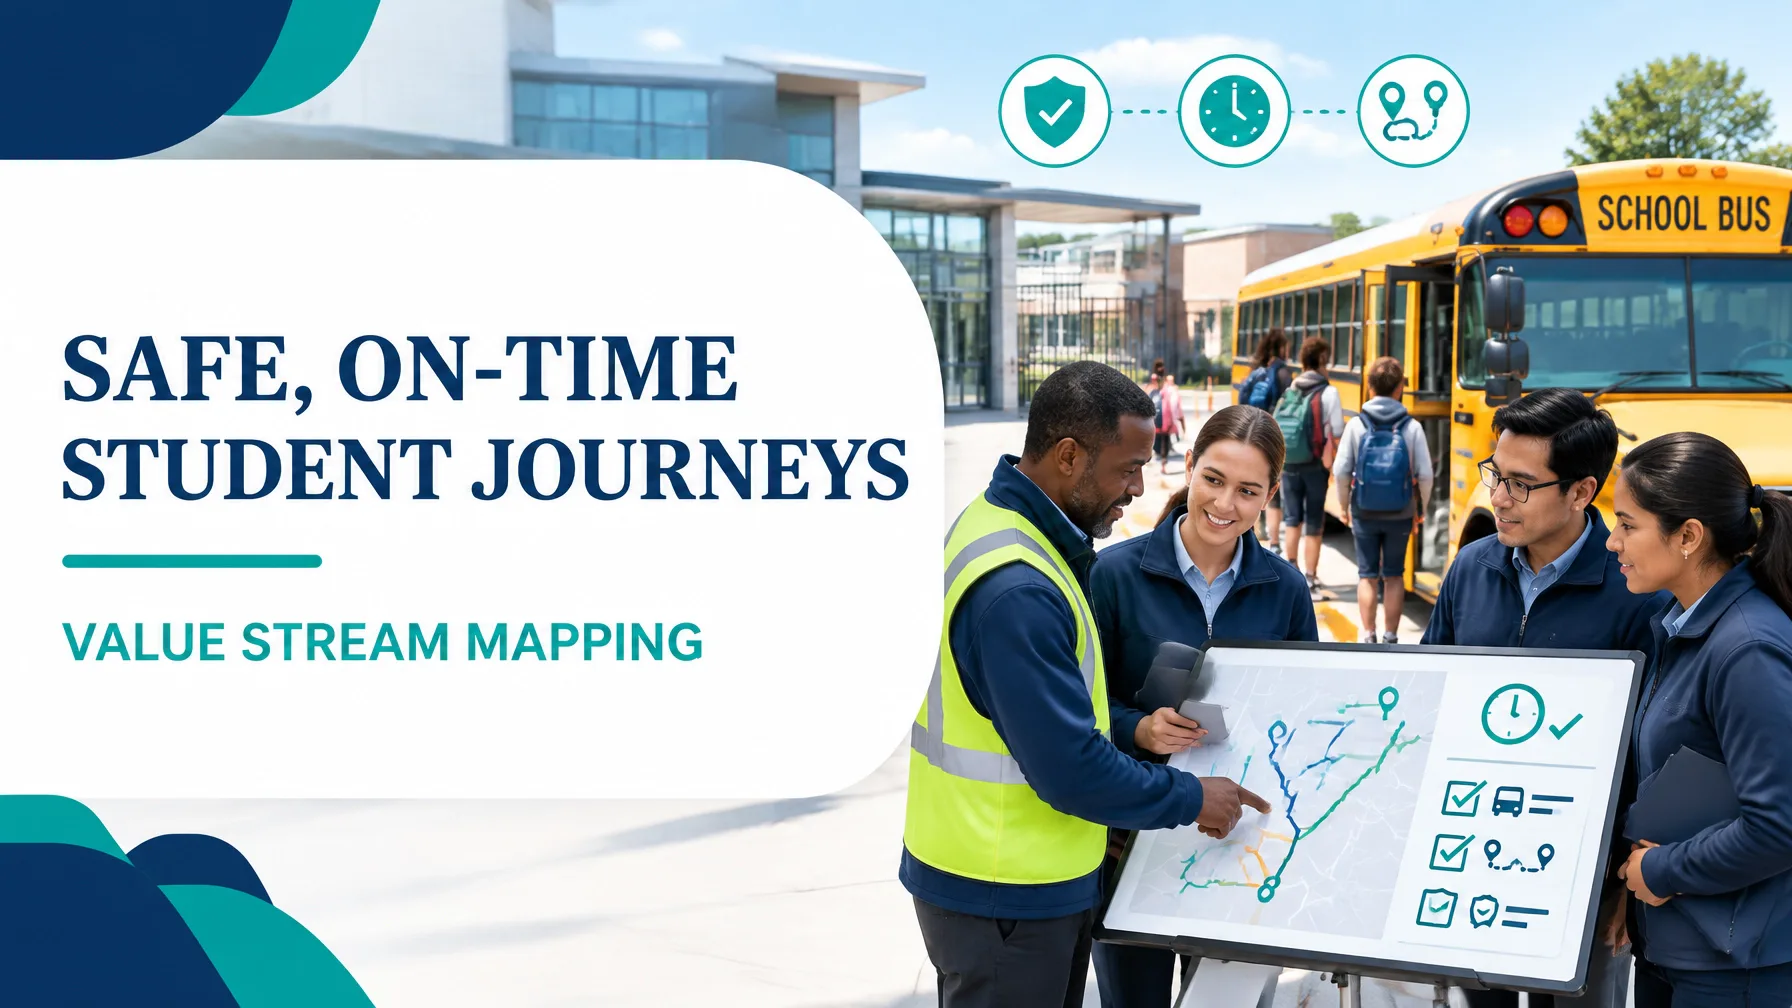
1. The Student Transport Value Stream: Reliability Is a Flow Problem
In the realm of student transport, value is defined by parents and schools in practical terms: a safe, on-time, predictable journey. A student must be collected from the correct stop, transported under appropriate duty-of-care controls, and handed over safely before the school bell.
That outcome depends on more than the number of buses available. Reliability is primarily a flow and variability problem. A route can have a suitable vehicle and still arrive late because:
- Driver sign-on takes longer than planned.
- Pre-trip checks vary between drivers.
- Students are absent without timely notification.
- Buses queue at a constrained school gate.
- Route changes travel slowly through email and manual run sheets.
- A driver no-show creates cascading schedule disruption.
Value Stream Mapping (VSM) makes these dependencies visible. It maps both the physical flow of buses and students and the information flow that releases, modifies, and controls each journey. The fundamental purpose is not simply to shorten trips. It is to protect safety while reducing avoidable waiting, variation, rework, and uncertainty.
For broader background, see Lean 6 Sigma Hub’s Lean Six Sigma concepts and glossary.
2. Scope Selection: Define the Complete Journey
The selected value-stream family is a 62-route student transport network carrying 4,300 students across two bell times.
The scope begins when routes and rosters are released and ends when the operating team has completed end-of-day reporting. It includes:
- Route planning and roster publication.
- Driver sign-on.
- Pre-trip vehicle inspection.
- Depot departure.
- First student pickup.
- All scheduled pickups and attendance exceptions.
- School gate arrival and queueing.
- Safe school drop-off and handover.
- Afternoon route reversal.
- End-of-day reporting and exception closure.
Excluded from this map are charter hire, long-distance excursions, and workshop repairs. Those are separate value streams with different demand patterns, controls, and customer requirements. A clear project scope boundary prevents the improvement team from mixing unlike processes.
3. Current-State Mapping: Where the Journey Loses Flow
The current-state map combines process boxes with measurable operating data:
Route release
   ↓
Email changes → Manual run sheet → Driver sign-on (8 min)
   ↓
Pre-trip inspection (14 min)
   ↓
Depot staging/release (6 min)
   ↓
Travel to first pickup (10 min)
   ↓
All pickups and student boarding (18 min)
   ↓
School approach and gate queue (4.2 min average)
   ↓
Safe drop-off and handover (5 min)
   ↓
Afternoon reversal → Manual end-of-day report (3 min)
The information flow is fragmented. Route changes are distributed by email, absentee notifications are often made by phone, and drivers rely on manual run sheets. This creates a delay between the moment an exception occurs and the moment the person who can act on it receives reliable information.
Current-state data should be collected at the gemba: the depot, route stops, and school gate. Observe actual cycle time rather than relying only on scheduled time. Capture driver sign-on duration, pre-trip inspection time, dwell time per stop, gate queue time, fleet availability, missed communications, and the number of safety-related exceptions.

4. Worked Example: One Morning Peak in Numbers
The following is an illustrative operating baseline for the 62-route network.
- Routes: 62
- Students: 4,300
- On-time arrival at first bell: 96.4%
- Late arrivals: 118 per week
- Stops with unregistered absences causing dwell overrun: 24%
- Average school gate queue: 4.2 minutes per bus
- Routes using a spare bus: 9.1%
- Average pre-trip inspection: 14 minutes
- Driver no-shows: 7 per week
Route-time calculation
For one representative route:
| Activity | Time |
|---|---|
| Driver sign-on | 8.0 min |
| Pre-trip inspection | 14.0 min |
| Depot staging and release | 6.0 min |
| Travel to first pickup | 10.0 min |
| Student pickup and boarding | 18.0 min |
| In-route travel with students | 24.0 min |
| School gate queue | 4.2 min |
| Safe drop-off and handover | 5.0 min |
| Manual reporting | 3.0 min |
| Total route cycle time | 92.2 min |
Therefore:
62 routes × 92.2 minutes = 5,716.4 route-minutes
That is 95.3 bus-hours of morning-cycle activity across the network.
For this example, value-added passenger movement time includes student boarding, in-route movement, and safe school handover:
18 + 24 + 5 = 47 minutes per route
Network value-added time is:
62 × 47 = 2,914 route-minutes
Using the Process Cycle Efficiency calculator:
PCE = Value-added time ÷ Total route cycle time
PCE = 2,914 ÷ 5,716.4 = 51.0%
This means approximately half of the measured route cycle is directly connected to moving and safely handing over students. The remainder is sign-on, inspection, staging, queueing, reporting, and other necessary or avoidable activity.
Takt-time calculation
Assume each bell-time group has 31 routes and a 20-minute arrival window:
Available time = 20 minutes × 60 = 1,200 seconds
Takt time = 1,200 seconds ÷ 31 buses = 38.7 seconds per bus
The school gate therefore needs to process one bus approximately every 38.7 seconds to meet the bell-time demand. An average queue of 4.2 minutes, equal to 252 seconds, represents more than six theoretical takt intervals. This points to gate capacity and arrival levelling as central improvement opportunities, not simply a need for more buses.
5. The Eight DOWNTIME Wastes in Student Transport
The following estimates use an illustrative 190-day school year and a blended operating cost of $85 per bus-hour where applicable.
- Defects: Incorrect or outdated run-sheet information contributes to late-arrival recovery. If 118 weekly late arrivals require eight minutes of additional intervention, the network loses about 787 bus-hours annually, equivalent to approximately $66,900.
- Overproduction: Maintaining six effective spare-bus assignments per peak, based on 9.1% of 62 routes, for 45 minutes per day creates approximately 855 standby bus-hours, or $72,675 in capacity cost.
- Waiting: Gate queues alone create:
4.2 minutes × 62 buses × 190 days = 49,476 bus-minutes, or 824.6 bus-hours. At the blended rate, that is approximately $70,100. - Non-utilised talent: Drivers and dispatchers spend an estimated 30 hours per week reconciling changes that could be automated. At $35 per hour, this represents approximately $49,400 annually in avoidable administrative effort.
- Transportation: A three-kilometre detour on every route adds:
3 km × 62 routes × 190 days = 35,340 kilometres. At $1.20 per kilometre, the estimated annual cost is $42,400. - Inventory: Excess paper forms, duplicate printed run sheets, and unstructured consumable storage tie up an estimated $18,000 in working capital and handling.
- Motion: Drivers walking between buses, lockers, and dispatch points for sign-on and paperwork can consume seven minutes per route. That is approximately 217 labour-hours annually, worth about $7,600.
- Extra-processing: Duplicate entry of attendance and route exceptions takes six minutes per route:
6 × 62 × 190 = 70,680 minutes, or 1,178 hours, representing approximately $41,200.
These figures are directional estimates, but they show how small delays accumulate across a large daily network.
6. Future-State Build: Level the Flow Without Compromising Safety
The future state should reduce variation while preserving every required safety control.
Key design changes include:
- A standardised pre-trip inspection using a visual checklist.
- 5S bus bays with clearly marked parking, equipment, and sign-on locations.
- Staggered school-gate slots agreed with each school.
- Parent-app confirmation of attendance to reduce absent-student dwell.
- Stable driver rosters supported by structured relief pools.
- Route levelling by load factor rather than assigning uneven passenger loads.
- Two-bin replenishment for workshop parts and consumables.
- Digital run sheets with live exception alerts.
- A daily visual board showing on-time performance, safety exceptions, no-shows, and unresolved delays.
The future-state principle is simple: release buses at a controlled pace, give drivers accurate information before departure, and escalate exceptions while there is still time to respond.

7. Current State Versus Future State
The future-state figures below are improvement targets for the illustrative case, not guaranteed results.
| Metric | Current state | Future-state target |
|---|---|---|
| Route cycle time | 92.2 min | 82.0 min |
| Value-added passenger time | 47.0 min | 46.0 min |
| Process Cycle Efficiency | 51.0% | 56.1% |
| On-time arrival | 96.4% | 99.2% |
| Average gate queue | 4.2 min | 1.5 min |
| Dwell overrun | 3.8 min | 1.2 min |
| Effective fleet availability | 90.9% | 97.5% |
| Driver no-shows | 7 per week | 2 per week |
| Cost per student journey | $8.40 | $7.55 |
The target PCE is calculated as:
46.0 ÷ 82.0 = 56.1%
The aim is not to remove essential inspection, safeguarding, or handover work. It is to eliminate avoidable waiting and administrative friction around those controls.
8. A 90-Day Kaizen Sequence
Days 1–30: Stabilise and measure
Actions
- Confirm the current-state map through route observation.
- Standardise driver sign-on and pre-trip inspection.
- Mark 5S zones in the depot.
- Record gate queue and stop-dwell data by route.
- Create a daily visual board.
Owners: Transport manager, depot supervisor, driver trainer.
Metric that moves: inspection variation, queue minutes, data completeness, and on-time baseline.
Days 31–60: Pilot the future state
Actions
- Pilot staggered gate slots with one bell-time group.
- Introduce digital run sheets and live exception alerts.
- Test parent attendance confirmation on selected routes.
- Establish a relief-driver pool and no-show escalation rule.
- Rebalance routes by load factor.
Owners: Transport manager and depot supervisor, with driver trainer coaching standard work.
Metric that moves: gate queue, dwell overrun, driver no-shows, and first-bell on-time percentage.
Days 61–90: Control and scale
Actions
- Expand the successful gate-slot model across all schools.
- Implement two-bin replenishment for critical consumables.
- Audit adherence to inspection and handover standard work.
- Review route performance weekly using control charts and Pareto analysis.
- Refresh the future-state map after the pilot.
Owners: Transport manager for governance, depot supervisor for daily control, driver trainer for competency verification.
Metric that moves: PCE, cost per student journey, effective fleet availability, and sustained on-time performance.
9. Build the Capability to Improve Complex Service Flows
This case demonstrates how current-state and future-state mapping, takt time, standard work, and Process Cycle Efficiency convert a broad reliability concern into a measurable improvement system. The same discipline applies to healthcare transport, logistics, public services, and other environments where safety, timing, and information accuracy must work together.
A CSSC-accredited Lean Six Sigma Green Belt course develops the practical skills to measure process performance, analyse causes, and lead structured improvements. Black Belt training extends that capability into advanced statistical analysis, complex project leadership, governance, and mentoring.
Explore Lean 6 Sigma Hub’s online training and develop the confidence to map a process, quantify its constraints, and build a safer, more reliable future state.
Pursue CSSC-accredited Green Belt or Black Belt certification at lean6sigmahub.com and turn value-stream evidence into measurable operational improvement.
Kaizen. Kai-Care. Kai-Done. Lean Six Sigma