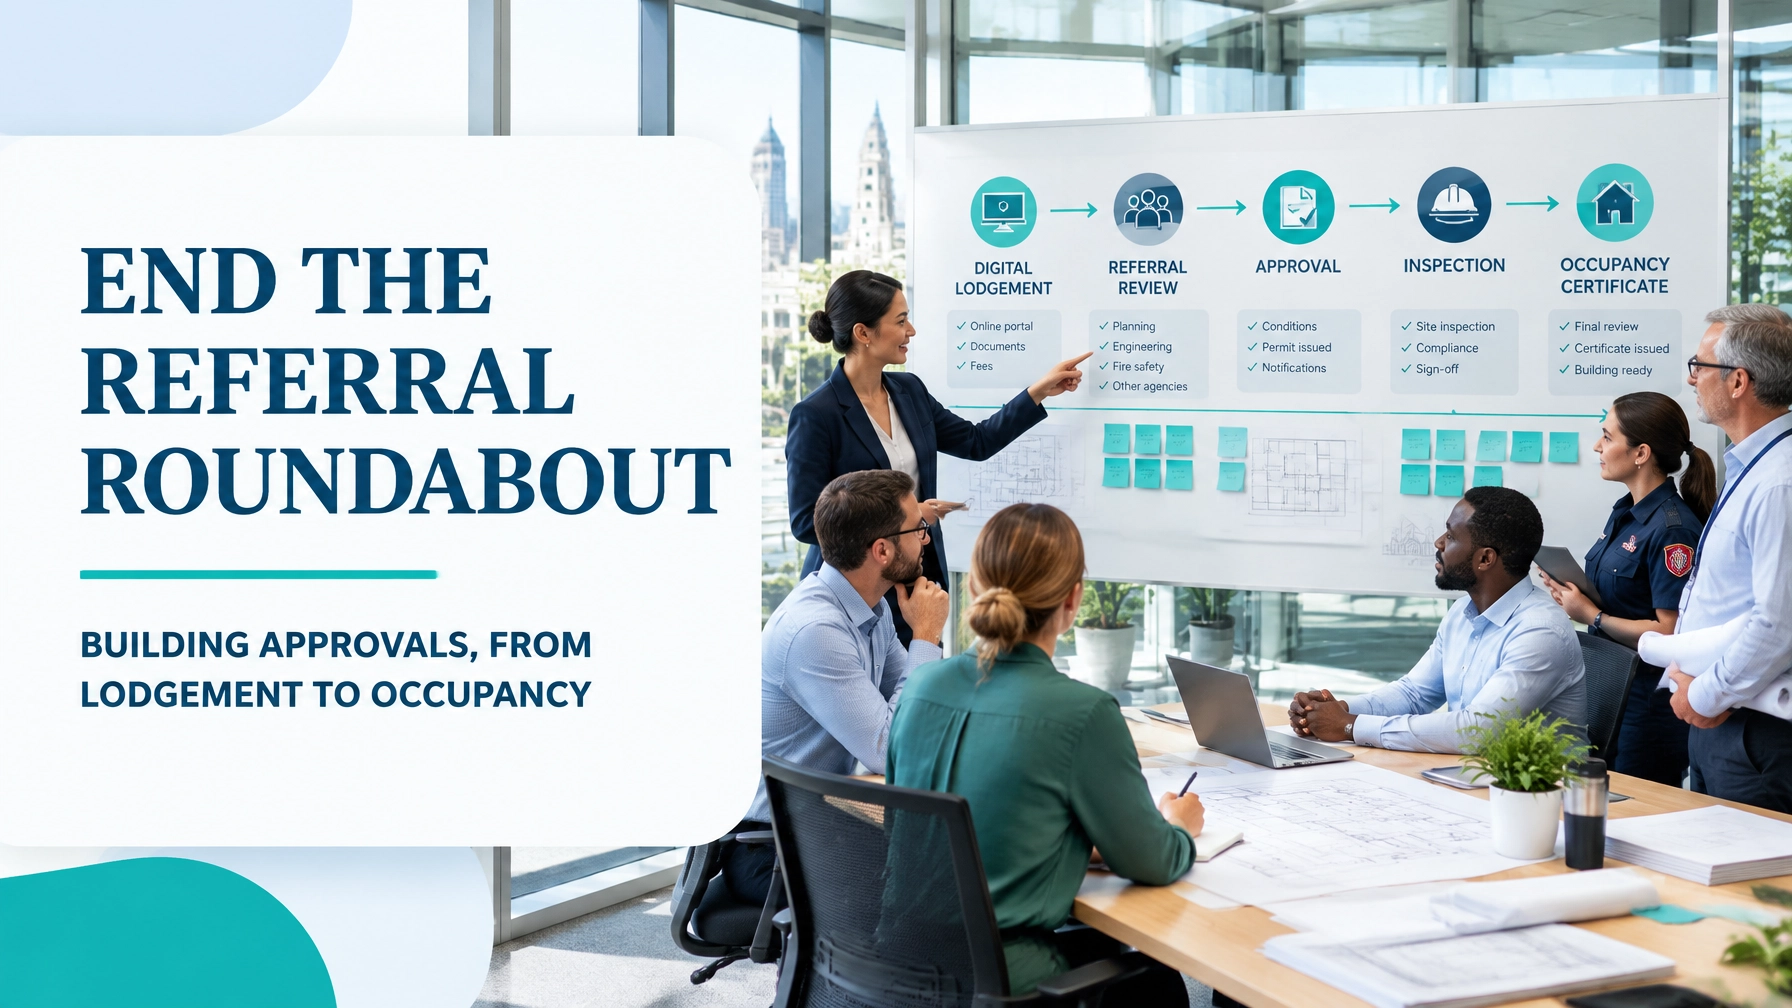
For a resident, builder, architect or developer, a building approval is not experienced as a collection of departmental tasks. It is experienced as one service: submit a compliant application, receive a decision, complete the required inspections and obtain permission to occupy.
When that journey becomes fragmented across planning, engineering, fire safety, traffic, building certification and records teams, lead time expands even when individual departments appear busy and productive. Applications wait for allocation, referrals circulate without clear ownership, request-for-information cycles repeat, and inspection-to-occupancy handovers become a final queue.
Value Stream Mapping (VSM) makes this entire service visible. It connects the flow of information with the flow of work, separates touch time from waiting time, and gives a municipality a practical blueprint for improvement.
This guide uses a worked, hypothetical example of standard residential dwelling approvals. The figures are illustrative rather than legal benchmarks. Local statutory requirements, approval pathways and occupancy certificate rules vary by jurisdiction. In New South Wales, for example, the final inspection and Occupation Certificate process is governed by specific requirements, including relevant development consent, construction certification and compliance documentation. See the NSW Government occupation certificate guidance and your local authority’s current requirements before changing operational controls.
Why This Value Stream Matters
The fundamental purpose of a municipal approval process is to protect the public interest while enabling compliant development to proceed with clarity and reasonable speed.
That means the customer does not define value as “the application was opened in the document management system.” Value occurs when the authority:
- Confirms the application is complete and correctly classified.
- Assesses it against applicable planning, building, engineering and safety requirements.
- Provides clear, consolidated information requests where clarification is necessary.
- Makes a timely, defensible decision.
- Coordinates inspections and compliance evidence.
- Issues the occupancy certificate or equivalent final authorisation when requirements are satisfied.
In Lean terms, value is determined by what the customer and community require: a safe, lawful and usable building approval. Every activity that does not advance that outcome should be challenged, simplified, combined or removed where governance permits.
A VSM therefore asks a more useful question than “Which department is slow?”
It asks:
Where does the application wait, loop, duplicate information or lose ownership between lodgement and occupancy?
The National Institute of Standards and Technology describes VSM as a method for visualising process and information flows, identifying waste and defining a future state. Its four-step structure: select the value stream, map the current state, define the future state and implement improvements, is directly applicable to public-sector approval services. Read the NIST overview of Value Stream Mapping.
Scope Selection: Map One Approval Family First
Attempting to map every development and building pathway at once will produce a complicated diagram with limited improvement value. Begin with a defined product or service family.
Recommended scope
Service family: Standard residential dwelling building permit and development approvals within one municipality.
Start point: Formal lodgement of the application through the online portal.
End point: Issue of the final occupancy certificate, or equivalent approval authorising occupation.
Included activities:
- Lodgement and fee validation.
- Completeness check and triage.
- Planning and building assessment.
- Internal and external referrals.
- Request-for-information cycles.
- Decision and approval administration.
- Inspection scheduling and final inspection.
- Compliance evidence review.
- Occupancy certificate handover.
Excluded activities:
- Pre-lodgement advice.
- Major commercial developments.
- Appeals and tribunal processes.
- Post-occupancy defect inspection schemes.
- Construction activity outside the authority’s control, except where it affects scheduling or documentation.
This scope is deliberately narrow. Standard residential applications have sufficient volume to generate reliable data while remaining similar enough for meaningful comparison. Once the future state works, the municipality can create separate maps for complex commercial, heritage, fire-engineered or integrated development pathways.
Build the Mapping Team Around the Whole Service
A VSM should not be created by one department in isolation. Include the people who perform, receive and depend on each handoff:
- Customer service and lodgement officers.
- Planning and development assessment officers.
- Building surveyors or certifiers.
- Engineering, drainage, traffic and stormwater reviewers.
- Fire safety and environmental specialists.
- Records and information management.
- Inspection and compliance staff.
- Digital workflow or service delivery specialists.
- A process owner with authority to remove barriers.
- A Lean Six Sigma facilitator, ideally a trained Black Belt or experienced Green Belt.
A White Belt can contribute basic process awareness and identify obvious sources of delay. A Yellow Belt can support data collection, facilitate local improvements and participate in kaizen events. A Black Belt should lead the more complex analysis, coach Green Belts and connect the project to broader governance.
Before drawing the map, review a representative sample, such as 100 completed applications, not just the fastest or most recent cases. Use actual timestamps from the portal, referral systems, email records, inspection schedules and certificate registers.
Current-State Map: The Referral Roundabout in Numbers
The following worked example represents the median journey for a sample of 100 standard residential applications.
Current-state flow
Lodge application
   ↓
Completeness check
   ↓
Triage and allocation
   ↓
Planning/building assessment
   ↓
Engineering + fire + traffic referrals
   ↺ clarification and referral loops
   ↓
RFI issued
   ↓
Applicant response and reassessment
   ↺ additional RFI where required
   ↓
Decision and approval
   ↓
Construction and final inspection request
   ↓
Inspection scheduling
   ↓
Final inspection
   ↓
Compliance evidence review
   ↓
Occupancy certificate issued

Worked current-state data
| Stage | Median touch time | Median waiting time | Observed issue |
|---|---|---|---|
| Lodgement and completeness check | 1.5 days | 4.5 days | 38% of applications require correction before acceptance |
| Triage and allocation | 0.8 days | 2.0 days | Manual classification and assessor availability |
| Planning and building assessment | 3.0 days | 6.0 days | Work enters a queue before assessment begins |
| Engineering, fire and traffic referrals | 2.5 days | 5.0 days | Referrals are often sequential rather than parallel |
| RFI preparation, response and reassessment | 3.5 days | 8.0 days | Median 1.6 RFI cycles per application |
| Decision and approval administration | 1.0 day | 3.0 days | Approval checkpoints create intermittent queues |
| Inspection scheduling and final inspection | 0.7 days | 3.0 days | Inspection request is not always complete at first submission |
| Occupancy evidence review and certificate issue | 1.0 day | 1.5 days | Missing certificates create final-stage rework |
| Total | 14.0 days | 33.0 days | 47 working days end to end |
The total is 47 working days, but only 14 days involve active staff touch time. The remaining 33 days are waiting, queueing, applicant response time, referral delay or rework.
That distinction is important. If a department reduces its own processing time by half but the application continues to wait between departments, the customer may see little improvement.
Lodgement completeness and first-time-right performance
In the sample:
- 62% of applications were accepted without a completeness correction.
- 38% required at least one correction before entering the formal assessment pathway.
- 21% contained documentation that was present but inconsistent across drawings, forms or reports.
- 14% required a second completeness contact because the first request did not consolidate all missing items.
- Average completeness-check touch time was 1.5 days, but the queue and applicant response extended the elapsed time to 6 days.
This is a classic quality problem. A completeness check that identifies only one missing item at a time creates avoidable rework, waiting and over-processing.
Referral loops
The application is referred to planning, engineering, fire and traffic disciplines. In the current state:
- Engineering responded within an average of 5 working days.
- Fire safety responded within 6 working days.
- Traffic responded within 4 working days.
- 44% of cases required clarification from at least one referral discipline.
- 18% returned to a previous discipline after another reviewer identified a related issue.
- The average number of referral loops was 1.8 per approval.
The problem is not that technical review exists. Technical review is essential. The problem is the absence of a clear referral package, defined entry criteria, shared information and a single case owner responsible for resolving cross-disciplinary issues.
Request-for-information cycles
An RFI may be necessary when an application genuinely lacks evidence or contains a material inconsistency. However, the current process produces an average of 1.6 RFI cycles.
A typical cycle consists of:
- Assessor identifies an issue.
- RFI is drafted.
- RFI waits for approval or quality review.
- Applicant receives the request.
- Applicant prepares a response.
- Response is uploaded.
- Staff determine whether the response is complete.
- The application returns to assessment.
- A second issue is discovered.
The applicant’s response time is not automatically waste from the authority’s perspective; some information must be produced externally. However, incomplete or fragmented RFIs create avoidable delay. A consolidated, plain-language RFI with a clear response checklist can reduce repeated contacts.
Statutory clock versus actual clock
Assume the municipality records the application as complete on day 6. The statutory assessment period begins at that point, subject to the applicable legislation and pathway.
In this example:
- Actual customer lead time: 47 working days.
- Time recorded as active assessment: 31 working days.
- Time paused or excluded due to referrals and information requests: 16 working days.
- Customer experience: still 47 working days.
This distinction matters for governance. A process can meet its reported statutory measure while still delivering an unsatisfactory end-to-end experience. The voice of the process shows one result; the voice of the customer experiences another.
The statutory clock should never be manipulated to conceal process performance. Instead, track both:
- Statutory clock: the legally defined assessment period.
- Actual clock: calendar or working time from lodgement to final outcome.
- Touch time: time staff actively work on the application.
- First-time-right yield: the proportion progressing without correction or rework.
The Eight DOWNTIME Wastes in Building Approvals
The DOWNTIME framework identifies eight forms of waste. Each appears in this value stream.
1. Defects
Examples include incomplete forms, inconsistent plans, missing certificates and referral responses that do not address the original question.
A useful countermeasure is a first-time-right lodgement checklist supported by portal validation and standard document naming.
2. Overproduction
Overproduction occurs when teams create reports, duplicate reviews or internal status updates that do not advance the decision. It can also occur when multiple disciplines independently request similar information.
Create one shared evidence register and one consolidated RFI wherever legally and technically appropriate.
3. Waiting
Waiting is the largest visible waste in the example: 33 of 47 working days are not active processing time.
Typical queues occur:
- Before completeness review.
- Before assessor allocation.
- Between planning and engineering.
- While waiting for referral responses.
- Before inspection booking.
- Before final certificate issue.
4. Non-utilised talent
Frontline customer service officers often know which document errors recur, while inspectors know which final-stage omissions cause avoidable re-inspections. If these insights are not captured, the municipality loses practical expertise.
Use daily huddles, structured improvement boards and an Affinity Diagram to group staff observations into themes such as “portal confusion,” “referral ambiguity,” “inspection evidence” and “approval governance.”
5. Transportation
Transportation applies to information as well as physical material. Examples include paper files, duplicated attachments, email chains and documents moved between disconnected systems.
A single digital case record should follow the application from lodgement to occupancy.
6. Inventory
In a service process, Work in Process (WIP) is the number of applications sitting in queues, inboxes or “awaiting review” states.
High WIP increases lead time because each new application competes for limited capacity. A useful control is a visible WIP limit by pathway and discipline.
7. Motion
Motion includes searching for documents, switching between systems, walking to locate files, manually checking duplicate records and repeatedly contacting other teams for status updates.
8. Extra processing
Extra processing includes duplicate data entry, repeated approvals of the same RFI, manual transcription of application data and inspections that repeat because the evidence pack was incomplete.
The goal is not to remove necessary controls. It is to ensure each control has a clear risk, legal or customer purpose.
Measurement: Turn the Map Into Evidence
A strong VSM combines operational observation with statistical discipline.
Establish the baseline
Use a Time Observation Sheet to record actual time spent on each step. Do not rely solely on procedure documents or staff estimates.
Track:
- Queue time.
- Touch time.
- Number of handoffs.
- Number of referrals.
- RFI cycles.
- Inspection attempts.
- Approval checkpoints.
- First-time-right yield.
- Occupancy certificate issue time.
For each measure, calculate the Average (Mean), median and spread. The mean provides a baseline, but it can be distorted by complex cases. A Box Plot can show the five-number summary (minimum, first quartile, median, third quartile and maximum) revealing skewness and outliers.
A Z-Score can identify unusual cases. For example, an application with a referral delay more than two standard deviations above the mean deserves investigation rather than being treated as normal variation.
Test variation properly
Variation in approval time may result from:
- Application complexity.
- Assessor workload.
- Referral type.
- Applicant response quality.
- Inspection availability.
- Seasonal demand.
Use Attribute Data such as complete/incomplete, approved/not approved, inspection passed/failed and certificate issued/not issued to monitor quality outcomes.
For continuous measures such as assessment days, referral days and inspection scheduling time:
- Use an X-bar Chart with an R chart to monitor changes in subgroup averages and within-group ranges.
- Use ANOVA to compare the means of three or more groups, for example, referral turnaround across engineering, fire and traffic.
- Before relying on ANOVA, use Bartlett’s Test or another appropriate variance test to assess whether group variances are sufficiently equal.
- Check for measurement Bias. If one team records queue start times at lodgement and another records them at allocation, the data will not be comparable.
Connect causes to outcomes
The Lean Six Sigma relationship Y = f(x) is highly relevant:
- Y: actual approval lead time, first-time-right yield or occupancy certificate turnaround.
- x factors: application completeness, referral package quality, assessor WIP, RFI structure, inspection capacity and approval policy.
The objective is not to control every variable. It is to identify the critical inputs that materially influence the outcome.
Future-State Design: Replace Handoffs With Flow

The future state should make the correct path easier to follow and the abnormal path easier to see.
Countermeasure 1: Digital completeness gate
Introduce a risk-based, standardised lodgement gate that checks:
- Required forms and fees.
- Mandatory plans and reports.
- Document version consistency.
- Required declarations and certificates.
- Correct application pathway.
Target 90% first-time-right lodgement within 90 days.
Countermeasure 2: One case owner
Assign a case owner at triage. This person does not perform every technical assessment but coordinates the flow, monitors due dates and consolidates cross-disciplinary questions.
Countermeasure 3: Parallel referrals
Where legislation and risk controls permit, send engineering, fire and traffic referrals in parallel using a standard digital referral pack.
Set service-level targets, for example, five working days for standard referrals and an escalation trigger at day four.
Countermeasure 4: Consolidated RFI protocol
Require assessors to distinguish between:
- Missing mandatory information.
- Clarification required.
- Technical non-compliance.
- Optional improvement suggestions.
Bundle material issues into one RFI wherever possible. Provide a response template showing the item, required evidence, responsible person and due date.
Countermeasure 5: Approval governance without bottlenecks
Approval is necessary for accountability, delegated authority and risk governance. However, formal checkpoints can become bottlenecks when every low-risk decision waits for the same senior approval.
Create approval bands:
- Standard, low-risk decisions proceed under delegated authority.
- Complex or exceptional matters receive specialist escalation.
- Governance review occurs through sampling, audit and trend analysis rather than repeated transaction-level delay.
Countermeasure 6: Andon-style escalation
Use an Andon signal in the workflow when:
- A referral exceeds its target.
- An RFI response is incomplete.
- A statutory or service-level threshold is approaching.
- An inspection cannot be scheduled.
- A certificate is blocked by missing evidence.
The purpose is not to blame a team. It is to make the abnormal condition visible while there is still time to respond.
Countermeasure 7: Autonomation and digital controls
Autonomation, or Jidoka, means building intelligence into the process so that an error or abnormal condition is detected and triggers a response.
Examples include:
- Portal validation that prevents submission without mandatory documents.
- Automatic duplicate-document detection.
- Alerts when a referral remains unanswered.
- Inspection booking rules that reject incomplete evidence packs.
- Automatic escalation when an application remains in the same status beyond its control limit.
Countermeasure 8: Risk-based inspection and occupancy handover
Create a standard final inspection checklist and digital evidence pack. Schedule inspections according to risk, readiness and geographic efficiency rather than first-come-first-served alone.
The handover should confirm:
- Inspection outcome.
- Required certificates.
- Outstanding conditions.
- Final plans or records.
- Decision authority.
- Occupancy certificate issue status.
Current State Versus Future State
The following targets represent a realistic improvement pathway, not a legal commitment.
| Metric | Current state | Future-state target | Improvement logic |
|---|---|---|---|
| End-to-end lead time | 47 working days | 27 working days | Reduce queues, referrals and RFI repetition |
| Active touch time | 14.0 days | 9.0 days | Remove duplicate entry and consolidate reviews |
| First-time-right lodgement rate | 62% | 90% | Portal validation and clearer requirements |
| Referral loops per approval | 1.8 | 0.6 | Standard packs, parallel review and one case owner |
| RFI cycles per approval | 1.6 | 0.7 | Consolidated RFIs and response templates |
| Inspections per approval | 1.4 | 1.1 | Readiness checklist and digital evidence |
| Actual clock paused or waiting | 33.0 days | 18.0 days | WIP limits, escalation and flow controls |
| Statutory-active assessment time | 31 days | 25 days | Faster assessment without weakening governance |
The future-state process does not attempt to eliminate every review or every inspection. It improves flow, quality and visibility while preserving statutory and safety obligations.
90-Day Kaizen Sequencing Plan
A disciplined improvement sequence prevents the municipality from launching multiple disconnected projects.
Days 1–30: Stabilise and see the work
Owners: Process owner, Black Belt, planning manager, customer service lead, digital workflow lead.
Actions:
- Confirm the residential approval service family.
- Validate the current-state map using 100 recent applications.
- Establish standard definitions for lodgement received, complete, assessment started, RFI issued, approval made, inspection requested and occupancy certificate issued.
- Introduce a daily visual management board.
- Start an Andon-style escalation list for overdue referrals and blocked inspections.
- Create a single-page completeness checklist.
- Begin measuring first-time-right lodgement, RFI cycles and actual lead time.
Targets by day 30:
- 95% of sampled cases have complete timestamps.
- 100% of active applications have a named case owner.
- Referral and RFI queues are visible daily.
- Baseline median lead time is confirmed.
Days 31–60: Create controlled flow
Owners: Referral discipline leads, assessment manager, records manager, service designer.
Actions:
- Pilot parallel engineering, fire and traffic referrals.
- Create a standard referral information pack.
- Introduce a consolidated RFI template.
- Set WIP limits for each assessment pathway.
- Configure digital alerts for referral and RFI ageing.
- Review approval checkpoints and remove duplicate sign-offs where delegation permits.
- Use an Affinity Diagram workshop to prioritise recurring applicant and staff issues.
Targets by day 60:
- First-time-right lodgement reaches 80%.
- Referral loops fall from 1.8 to 1.0 or fewer.
- Median RFI cycles fall from 1.6 to 1.0.
- At least 80% of standard referrals are issued in parallel.
- No application remains without an owner or next action.
Days 61–90: Sustain and scale
Owners: Department director, process owner, Black Belt, inspection manager, governance lead.
Actions:
- Launch the risk-based inspection readiness checklist.
- Integrate final inspection evidence with the occupancy certificate workflow.
- Establish X-bar and R monitoring for assessment and referral times.
- Review ANOVA results by referral type and pathway.
- Conduct a break-even analysis for portal enhancements, workflow automation and inspection scheduling changes.
- Publish a monthly performance dashboard.
- Document standard work and train White, Yellow and Green Belt participants.
- Select the next service family for mapping.
Targets by day 90:
- Median end-to-end lead time reaches 27–32 working days.
- First-time-right lodgement reaches 90%.
- Referral loops reach 0.6 or fewer.
- RFI cycles reach 0.7 or fewer.
- Inspections per approval reach 1.1.
- Occupancy certificate handover is measured as a distinct process step.
Make the Business Case for Sustainable Improvement
A persuasive Business Case should connect customer outcomes, compliance confidence, workforce capacity and financial impact.
For example, suppose the municipality processes 1,200 standard residential applications each year. Reducing avoidable staff touch time by 3 days per application creates:
- 3 days × 1,200 applications = 3,600 staff-days of capacity released.
- If one staff-day is valued at $650, the theoretical capacity value is $2.34 million.
- This is not automatically a cash saving; it may instead support service growth, backlog reduction, resilience or redeployment.
Use Break-Even Analysis to compare improvement investment with measurable benefits. If a digital workflow enhancement costs $180,000 and releases $60,000 of annual avoidable capacity value, the simple break-even point is three years.
The principle of Zero Defects, associated with Philip Crosby, should be applied carefully: do things right the first time, but do not confuse zero avoidable defects with zero risk or zero human judgement. Public-sector approval must remain evidence-based and defensible.
Throughput is the number of complete approvals delivered per period. Takt Time can be adapted to service demand: if 100 standard applications arrive per month and the team has 20 available working days, the system must complete approximately 5 applications per day to prevent WIP growth.
The Theory of Constraints then asks: which step currently limits throughput? If fire referrals are the constraint, improving lodgement alone will eventually increase the queue before fire review. Improve the constraint first, then rebalance the system.
Connect VSM With Agile and DMAIC
An Agile approach complements Lean Six Sigma when the future state requires iterative testing. Instead of designing a perfect portal workflow for twelve months, release a minimum viable checklist, test it with one pathway, review the data after two weeks and refine it.
Use DMAIC discipline:
- Define: establish the customer, service family, problem statement and business case.
- Measure: capture actual lead time, touch time, queues, RFI cycles and referral performance.
- Analyse: identify root causes with Pareto analysis, process observation, Box Plots, ANOVA and cause-and-effect analysis.
- Improve: pilot parallel referrals, digital validation, WIP controls and standardised inspection handover.
- Control: use dashboards, standard work, control charts and governance reviews.
In the Analyse Phase, do not assume that the longest step is the root cause. A referral may take six days because the referral package is incomplete, because the discipline is capacity constrained or because a prior approval is missing. Test the relationship between inputs and outputs.
The Strategic Result
A building approval value stream becomes more reliable when the municipality stops optimising isolated departmental activity and starts managing the complete customer journey.
The desired future state is not simply “approve faster.” It is:
- Clearer lodgement requirements.
- Higher first-time-right yield.
- Fewer referral loops.
- Consolidated RFIs.
- Visible queues and escalation triggers.
- Risk-based inspections.
- A controlled handover to the occupancy certificate.
- Defensible governance with fewer unnecessary bottlenecks.
This is how a municipality moves from a referral roundabout to a connected value stream.
If you want to lead this kind of improvement, begin with structured training. Explore Lean Six Sigma online training, review the Green Belt certification pathway, or use the Process Cycle Efficiency Calculator to quantify the relationship between touch time and total lead time.
Pursue Lean Six Sigma certification and learn how to map, analyse and improve the complete service, not just one departmental step.
Kaizen. Kai-Care. Kai-Done. ( Lean Six Sigma)