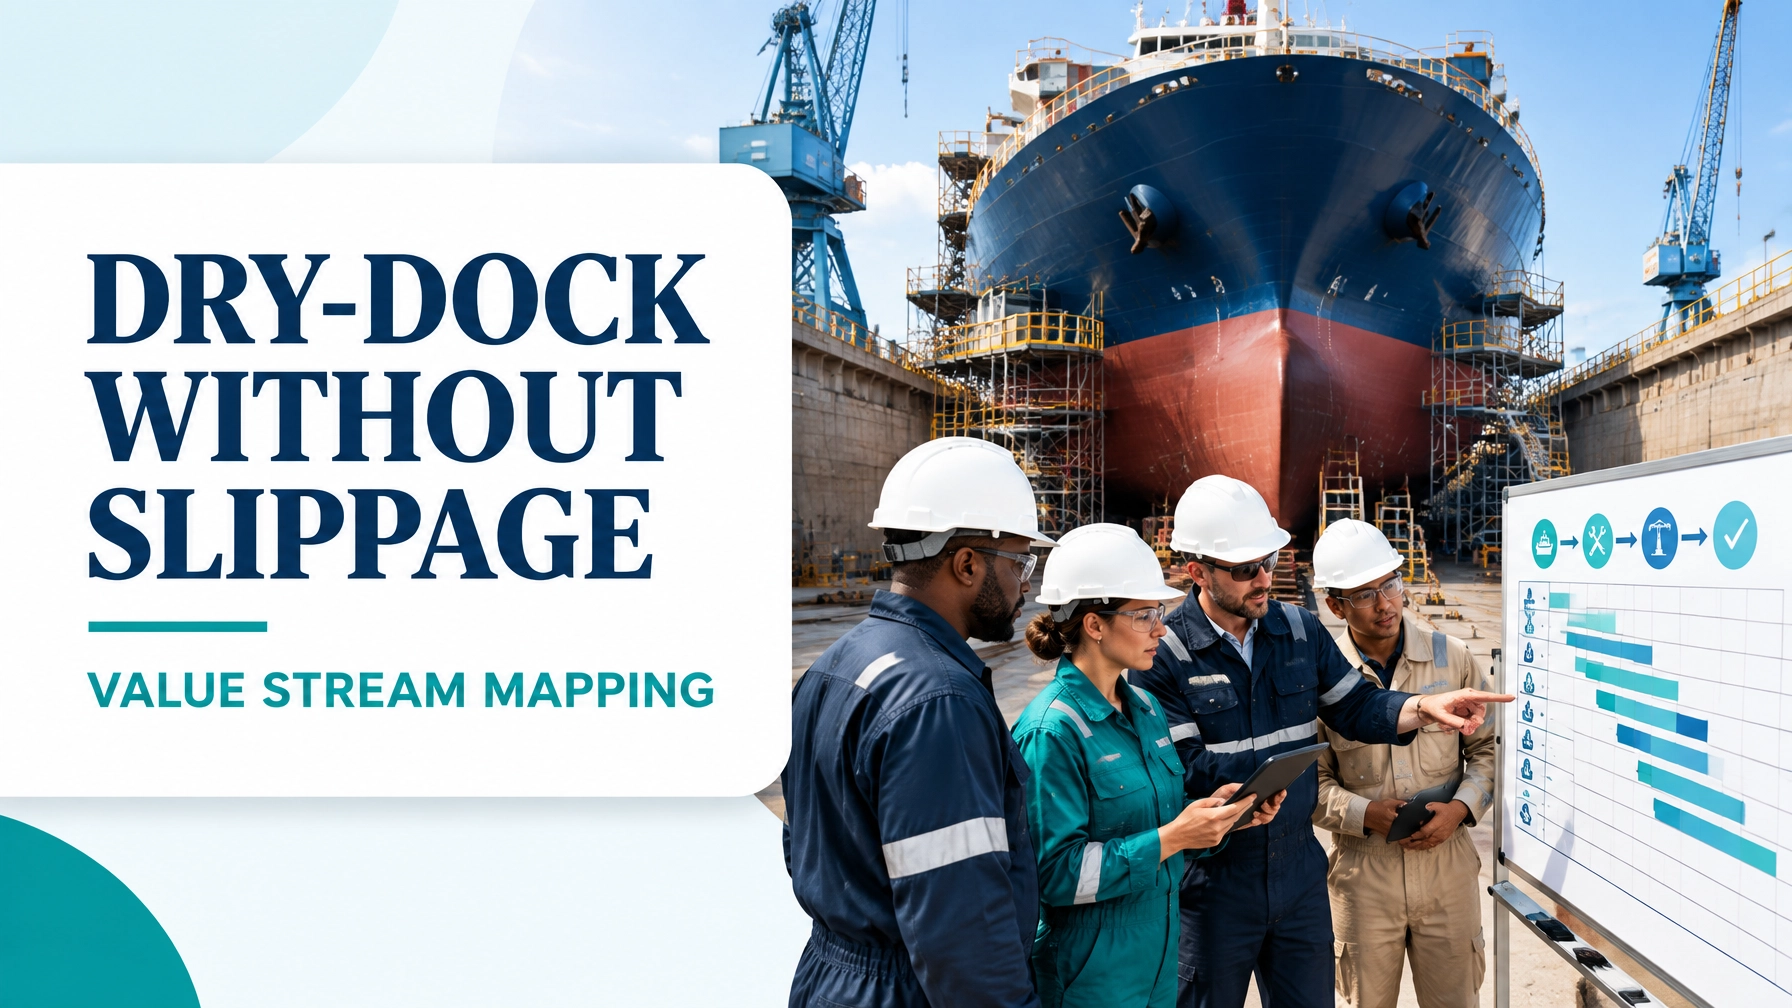
Ship dry-docking is a high-value, high-risk service stream. A commercial vessel enters the yard for a defined maintenance window and must leave safe, compliant, reliable, and ready to trade. Every hour of delay can increase off-hire exposure, contractor cost, berth congestion, charter disruption, and pressure on the crew.
The fundamental purpose of Value Stream Mapping (VSM) in this environment is to make the entire flow visible: material, information, approvals, inspections, labour, decisions, and vessel movement. Rather than viewing hull treatment, steel renewal, tank work, machinery overhaul, class surveys, and sea trials as separate work packages, VSM connects them as one end-to-end value stream.
This deep-dive uses an illustrative commercial vessel dry-docking case study. The numbers are designed for training and improvement planning; each yard should replace them with validated historical data.
The target outcome is straightforward:
- Reduce dock occupancy without compromising safety or class compliance.
- Eliminate avoidable waiting between work packages.
- Reduce rework and late variation orders.
- Improve the probability of re-floating within the planned window.
- Create a repeatable operating system for the next docking.
The approach is consistent with practical dry-docking guidance that recommends early scope development, survey coordination, detailed work sequencing, critical-path control, and structured sea-trial preparation. See the dry-docking planning guide from Nautilus Shipping and the complete dry-docking process guide from Marine Inspection for additional maritime context.
1. Scope Selection: Define the Value Stream Before Mapping It
A VSM is only useful when its boundaries are explicit. Mapping “the whole shipyard” creates an attractive diagram but weak decisions. The team should select a product or service family with common process steps, measurable demand, and a clear customer outcome.
Selected service family
Scheduled dry-docking of a commercial cargo vessel for class-related maintenance and reliability restoration.
Start point
The vessel arrives at the yard gate and the docking plan is confirmed through arrival inspection, block placement, and work release.
End point
The vessel completes harbour checks and sea trials, receives the required technical and class sign-offs, and is released for commercial service.
Included work packages
- Pre-docking scope freeze and work-package readiness.
- Vessel arrival, docking, and safe access.
- Hull washing, inspection, and thickness measurement.
- Steel renewal and associated welding inspections.
- Hull blasting, coating, curing, and final inspection.
- Tank cleaning, gas-free certification, inspection, and coating.
- Main engine and auxiliary machinery overhaul.
- Sub-contractor mobilisation and work completion.
- Class survey hold points and approval.
- Re-float, harbour trials, sea trials, and close-out.
Why this scope was chosen
This scope contains the primary sources of schedule variation:
- Work discovered after docking.
- Interdependence between steel, coating, tank access, and inspection.
- Specialist contractor availability.
- Missing spares and technical information.
- Class or owner approval delays.
- A narrow re-float and sea-trial window.
The project team should establish the Voice of the Customer (VOC) by asking what the ship operator values most: safe redelivery, class compliance, predictable cost, reliable machinery, and minimum off-hire time. The Voice of the Business (VOB) adds commercial priorities such as dock utilisation, margin, contractor productivity, and asset availability. The Voice of the Process (VOP) comes from actual performance data: elapsed time, rework, queue time, inspection response, and accepted work packages.
A practical project scope boundary calculator can support the Define phase by clarifying what belongs inside the project and what remains outside it.

2. Current-State Map: What the Numbers Reveal
Illustrative docking plan
The vessel is planned for 21 dock days. The work list contains:
- 18,600 m² of hull blast and coating activity.
- 42 tonnes of steel renewal.
- 11,400 m² of tank cleaning and preparation.
- 96 hours of main engine overhaul work.
- 64 hours of auxiliary machinery overhaul work.
- Three specialist sub-contractors: coating, steel fabrication, and engine services.
- Nine class or owner inspection hold points.
- A planned re-float window at 06:00 on Day 21, followed by harbour checks and sea trials within 24 hours.
The current-state map shows more than task duration. It records the flow of decisions, approvals, information, people, materials, and queues.
Current-state walkthrough
Step 1: Arrival and docking, Day 0 to Day 1
The vessel arrives with the preliminary work list approved, but the scope is not fully frozen. The arrival inspection identifies additional corrosion around two ballast tanks and several shell plates.
The yard requests clarification on:
- Steel renewal limits.
- Coating boundaries.
- Whether the additional tank work is mandatory or discretionary.
- Class attendance requirements.
- The commercial approval route for variations.
The vessel is safely docked, but 18 hours pass before the final steel scope is released.
Step 2: Hull inspection and steel renewal
The planned steel renewal quantity is 30 tonnes. After thickness measurements and close-up inspection, the actual requirement increases to 42 tonnes.
The additional work is technically reasonable, but the approval chain creates a queue:
- Yard submits thickness data.
- Owner’s superintendent reviews the proposal.
- Class surveyor confirms the repair method.
- Commercial manager approves the variation.
- Fabricator releases the updated cutting list.
The physical steel renewal requires approximately 96 elapsed hours, but the associated approval and material queue adds 32 hours. Steel completion therefore becomes the primary bottleneck.
A bottleneck is a constrained process step that limits overall flow and capacity. In this case, the constraint is not only welding productivity. It is the combined capacity of steel fabrication, class review, and access to the affected tank and hull areas.
Step 3: Hull blasting and coating
The hull treatment plan requires:
- Washing and preparation: 1 day.
- Abrasive blasting: 2 days.
- Primer and intermediate coat: 1 day.
- Antifouling application: 1 day.
- Curing and final inspection: 1 day.
The planned work content is approximately 18,600 m². However, blasting begins 14 hours late because steel renewal remains open in two areas. A further 10-hour delay occurs when the coating inspector is assigned to another vessel.
The result is not merely a late coating start. It compresses curing time, reduces schedule flexibility, and pushes final draft-marking and underwater inspection closer to the re-float window.
Step 4: Tank cleaning and inspection
The tank work covers 11,400 m² across ballast, fuel, and void spaces. The original schedule assumes that tanks will be cleaned and gas-free before the vessel arrives.
In practice:
- Two tank cleaning crews arrive 10 hours late.
- Gas-free certification is incomplete for one tank.
- Access scaffolding is not ready in three spaces.
- The class surveyor receives only part of the inspection pack.
Tank cleaning and preparation require 60 hours of direct work, but the total elapsed time is 108 hours. The difference is waiting, access conflict, and repeated preparation.
Step 5: Machinery overhaul
The main engine overhaul is planned at 96 hours, supported by 64 hours of auxiliary machinery work. The specialist engine contractor mobilises on Day 2, but one measurement tool and two gasket kits are not available.
The contractor performs other tasks while waiting, but productive work is interrupted. A clearance reading later falls outside the expected range, requiring an additional inspection and partial reassembly.
The final result is:
- Main engine direct work: 96 hours planned.
- Actual work: 112 hours.
- Rework: 16 hours.
- Contractor idle time: 46 hours.
- Auxiliary machinery work: 64 planned hours, 72 actual hours.
Step 6: Class survey hold points
The current state contains nine hold points:
- Thickness measurement and repair scope.
- Steel fit-up before welding.
- Weld completion and NDT.
- Tank gas-free certification.
- Tank coating readiness.
- Hull surface preparation.
- Coating dry-film thickness.
- Machinery clearance and alignment.
- Harbour-test readiness before sea trials.
Hold points protect governance and quality, but poorly designed approval processes create bottlenecks. In the current state, the nine hold points generate 46 hours of waiting, including:
- 18 hours waiting for scope confirmation.
- 10 hours waiting for class attendance.
- 8 hours waiting for incomplete documentation.
- 6 hours waiting for a responsible approver.
- 4 hours waiting for re-inspection after an initial defect.
The issue is not the existence of approval. The issue is that readiness criteria, ownership, and response times are unclear.
Step 7: Re-float and sea trials
The vessel misses the planned Day 21 re-float window by 14 hours. The next available tide and berth arrangement creates a further 34-hour delay.
The vessel eventually re-floats on Day 23 and completes sea trials on Day 24. The dock plan therefore moves from 21 planned days to 24 actual days.
Current-state data summary
| Measure | Planned | Current actual |
|---|---|---|
| Dock duration | 21 days | 24 days |
| Hull blast and coat area | 18,600 m² | 18,600 m² |
| Steel renewal | 30 tonnes | 42 tonnes |
| Tank cleaning/preparation | 11,400 m² | 11,400 m² |
| Main engine overhaul | 96 hours | 112 hours |
| Auxiliary machinery overhaul | 64 hours | 72 hours |
| Class/owner hold points | 9 | 9 |
| Hold-point waiting | 18 hours allowance | 46 hours |
| Sub-contractor idle time | 30 hours allowance | 118 hours |
| Rework rate | 5.0% target | 11.5% |
| On-time re-float rate across comparable dockings | 85% target | 62% |
| Total cost variance | ≤3.0% | +8.7% |

3. The Eight DOWNTIME Wastes in Dry-Docking
The eight Lean wastes are not abstract concepts in a shipyard. They appear as measurable delays, additional movement, excess cost, and avoidable pressure near re-float.
1. Defects
Examples include:
- Welds requiring repair after NDT.
- Coating thickness outside specification.
- Incorrect machinery clearances.
- Incomplete or inaccurate inspection documentation.
The current case produces 11.5% rework across selected work packages.
2. Overproduction
Overproduction occurs when work is completed earlier or in greater quantity than the next process can use.
Examples include:
- Preparing coating materials before steel boundaries are confirmed.
- Fabricating steel parts before the latest drawing is approved.
- Producing inspection packs before the equipment is actually ready.
3. Waiting
Waiting is the largest visible waste in the current state:
- 46 hours at class and owner hold points.
- 34 hours caused by the missed re-float window.
- Contractor delays caused by missing tools and spares.
- Tank-entry delays caused by incomplete gas-free certificates.
4. Non-utilised talent
Ship staff, fitters, engineers, planners, and survey coordinators often hold valuable knowledge about recurring defects and equipment history. If they are consulted only after the vessel arrives, the organisation loses the opportunity to prevent late discoveries.
5. Transportation
Unnecessary movement includes:
- Moving steel plates between remote storage and fabrication zones.
- Transporting tools between the dock and engine room.
- Moving inspection documents between yard offices, vessel control rooms, and class representatives.
6. Inventory
Excess or poorly controlled inventory creates searching and storage waste. Insufficient inventory creates even greater risk when critical gaskets, coating materials, fasteners, or specialist tools are missing.
7. Motion
Examples include:
- Surveyors walking between work fronts because readiness status is unclear.
- Crews repeatedly accessing tanks to confirm whether work can start.
- Supervisors searching for the latest drawings or permits.
8. Extra-processing
Extra-processing includes:
- Re-entering the same inspection data into several systems.
- Creating reports without clear acceptance criteria.
- Repeating measurements because equipment calibration or method requirements were unclear.
- Obtaining sequential approvals when a parallel technical review would be sufficient.
A process cycle efficiency calculator can help compare direct value-adding work against total elapsed time.
4. The Analytical Layer: Turning Dry-Dock Data Into Decisions
A mature VSM combines practical observation with DMAIC discipline.
- In the Define phase, establish the business case: if one day of off-hire costs $54,000, a three-day delay creates an exposure of $162,000 before additional contractor and berth costs.
- In Measure, use a Time Observation Sheet to record actual step times, waiting, travel, approval response, and rework.
- In Analyse, identify root causes through process maps, Pareto charts, cause-and-effect diagrams, box plots, and stratified data.
- In Improve, test countermeasures through controlled pilots.
- In Control, use standard work, visual management, audit checks, and trend charts.
Several Lean Six Sigma concepts are especially useful:
- An Affinity Diagram can organise 87 pre-docking observations into six natural categories: scope, materials, access, people, approvals, and testing.
- Attribute data, such as Pass/Fail for gas-free certification or Ready/Not Ready for a class hold point, supports quality tracking.
- Variable data, such as hours, tonnes, square metres, cost, and temperature, supports deeper statistical analysis.
- Average (mean) provides a baseline for inspection response time, contractor mobilisation, or work-package duration.
- A Box Plot reveals spread, skewness, and outliers in docking duration across comparable vessels.
- A Z-Score shows whether a docking or work package sits several standard deviations from the historical mean.
- ANOVA can compare the mean delay across steel, tank, machinery, and coating workstreams. Bartlett’s Test should be considered beforehand when assessing whether group variances are sufficiently equal for the analysis.
- Measurement bias must be controlled. For example, different ultrasonic thickness devices or operators may systematically influence steel-renewal decisions.
- An X-bar Chart, used alongside an R chart, can monitor average inspection-response time and detect shifts or trends.
- Yield should be measured through First Pass Yield for accepted work packages and Rolled Throughput Yield across the complete sequence.
- The principle Y = f(x) is highly relevant: re-float readiness, the output Y, depends on critical inputs such as scope completeness, material availability, inspection response, work quality, and weather conditions.
- Zero Defects, associated with Philip Crosby’s “do it right the first time” philosophy, does not mean ignoring the possibility of findings. It means designing the process to prevent avoidable defects and rework.
The Business Case should quantify the cost of delay, rework, idle resources, and late variation. A simple break-even analysis can support investment decisions. If a digital readiness system costs $18,000 and avoids only $54,000 of off-hire exposure, the improvement breaks even after preventing one-third of a delay day.
5. Future-State VSM: Design the Flow Before the Vessel Arrives

The future state must remove avoidable queues while retaining safety, technical integrity, and class governance.
Countermeasure 1: Freeze the scope using a readiness gate
At T-30 days, freeze the baseline scope. At T-14 days, conduct a formal readiness review covering:
- Approved work packages.
- Latest drawings and repair methods.
- Class survey matrix.
- Critical spares and special tools.
- Sub-contractor mobilisation dates.
- Tank-cleaning and gas-free plan.
- Harbour-test and sea-trial requirements.
- Named approvers and escalation routes.
Late discoveries will still occur. The improvement is to separate mandatory technical findings from discretionary additions and process each through a visible variation route.
Countermeasure 2: Use pull scheduling for class and owner inspections
Each hold point should have:
- A defined readiness checklist.
- One responsible owner.
- A planned attendance window.
- A maximum response time.
- A digital status: Not Ready, Ready, Inspected, Released, or Rework Required.
This transforms approval from an unplanned queue into a controlled pull signal.
Countermeasure 3: Create integrated work packages
Each package should include:
- Scope statement.
- Drawings and specifications.
- Labour requirement.
- Tools and spares.
- Safety controls.
- Inspection and test plan.
- Acceptance criteria.
- Predecessors and successors.
- Target completion time.
For example, the steel-renewal package should not be considered ready until the repair sketch, steel plate, welding procedure, NDT plan, access, and class attendance route are confirmed.
Countermeasure 4: Pre-kit materials and specialist equipment
The engine package should be physically verified before mobilisation:
- Gaskets and seals.
- Bearings and fasteners.
- Calibration equipment.
- Measurement tools.
- Lifting plans.
- Manufacturer instructions.
- Test forms.
This reduces both inventory searching and contractor idle time.
Countermeasure 5: Introduce visual management and Andon escalation
A digital or physical board should display:
- Work package status.
- Planned versus actual hours.
- Open hold points.
- Critical-path tasks.
- Missing materials.
- Rework items.
- Re-float readiness.
An Andon signal can alert the team in real time when a work package is blocked by a missing part, unsafe condition, failed inspection, absent approver, or technical decision.
Where appropriate, Autonomation (Jidoka) can support detection and response. Examples include coating-environment sensors that trigger an alert when temperature or humidity falls outside limits, or digital test equipment that prevents a record from being closed without a valid calibration status.
Countermeasure 6: Apply Agile coordination to the dock plan
Agile does not replace the master schedule. Its flexible, iterative approach complements Lean Six Sigma by enabling two-day planning cycles:
- Confirm the next 48 hours of work.
- Review actual progress and constraints.
- Re-sequence tasks without losing the critical path.
- Escalate decisions that cannot wait.
- Update the visual board.
This is particularly useful when the vessel reveals new findings while the team must still protect the re-float window.
Countermeasure 7: Manage the constraint using Theory of Constraints
The Theory of Constraints asks the team to:
- Identify the system constraint.
- Exploit its available capacity.
- Subordinate other activities to it.
- Elevate the constraint if necessary.
- Repeat when the constraint moves.
If class survey availability is the constraint, the yard should prepare inspection packs early, batch compatible hold points, and reserve attendance windows. If steel fabrication is the constraint, material cutting, drawings, access, and welding resources should be prioritised around it.
6. Current Versus Future State
The following target state assumes that the countermeasures are implemented without reducing safety requirements or weakening class controls.
| Measure | Current state | Future-state target | Improvement |
|---|---|---|---|
| Dock duration | 24 days | 20.5 days | 3.5 days |
| Rework rate | 11.5% | 4.0% | 7.5 percentage points |
| Hold-point waiting | 46 hours | 14 hours | 32 hours |
| Sub-contractor idle time | 118 hours | 32 hours | 86 hours |
| On-time re-float rate | 62% | 92% | 30 percentage points |
| Total cost variance | +8.7% | +2.0% | 6.7 percentage points |
| First Pass Yield | 78% | 93% | 15 percentage points |
| Accepted work packages per dock day | 3.8 | 5.0 | 31.6% increase |
The future-state throughput is measured as accepted work packages per day, not merely labour hours expended. The objective is to complete more right-first-time work while reducing work in process.
Excess Work in Process (WIP) (open jobs, partly assembled machinery, uninspected welds, unapproved drawings, and incomplete coating areas) creates waiting, storage, overproduction, and scheduling instability. The future map should limit WIP around the constraint and release new work only when the next process is ready.
Takt Time can also support planning. If the dock has 20 available execution days and 14 major work packages must be completed, the planning rhythm is approximately 1.43 days per package. This is not a rigid production rate; it is a warning signal when the acceptance rhythm falls behind the available window.
7. 90-Day Kaizen Sequencing Plan
Days 1–30: Stabilise and make the work visible
Owners: Docking superintendent, fleet technical manager, class coordinator, yard planner.
Actions:
- Collect the last five comparable docking schedules.
- Build the current-state VSM.
- Establish baseline data for waiting, rework, idle time, and cost variance.
- Create the scope-freeze checklist.
- Build the class survey and hold-point matrix.
- Define standard work for steel, coating, tanks, machinery, and sea trials.
- Introduce a daily visual management meeting.
Targets:
- 100% of work packages have an owner and acceptance criterion.
- 100% of critical spares verified by T-14 days.
- Reduce unidentified hold-point waiting by 25%.
- Achieve 90% completion of the pre-docking readiness checklist.
Days 31–60: Pilot pull planning and constraint control
Owners: Yard planner, class survey coordinator, procurement lead, contractor managers.
Actions:
- Pilot pull-based inspection scheduling on one vessel or one major workstream.
- Pre-kit the main engine overhaul package.
- Introduce Andon escalation for blocked work.
- Use a 48-hour Agile planning cycle.
- Review contractor mobilisation against the actual workfront.
- Apply ANOVA and stratification to identify the largest delay categories.
Targets:
- Reduce hold-point waiting from 46 to 25 hours or less.
- Reduce sub-contractor idle time by 50%.
- Improve First Pass Yield to 88%.
- Complete 95% of planned inspections within the agreed response window.
Days 61–90: Standardise, control, and scale
Owners: Black Belt or improvement lead, fleet operations manager, quality manager, yard leadership.
Actions:
- Update the standard dry-docking specification.
- Establish a control plan for scope, spares, inspection, coating, and sea trials.
- Create an X-bar/R monitoring routine for key response-time measures.
- Audit the scope-freeze process at T-30 and T-14.
- Conduct a formal kaizen review after re-float.
- Replicate the future-state VSM across comparable vessels.
Targets:
- Dock duration at or below 21 days for the selected service family.
- Rework at or below 4%.
- Hold-point waiting at or below 14 hours.
- Sub-contractor idle time at or below 32 hours.
- On-time re-float rate at or above 92%.
- Total cost variance within +2%.
8. Build the Capability Behind the Improvement
A White Belt gives team members awareness of Lean Six Sigma principles and DMAIC. A Yellow Belt supports larger improvement projects by collecting data, participating in problem-solving, and sustaining standard work.
A Green Belt can lead the dry-docking improvement project, conduct structured analysis, facilitate kaizen events, and manage measurable benefits. A Black Belt leads advanced cross-functional projects, mentors Green Belts, validates statistical conclusions, and helps embed the improvement into the organisation’s management system.
For maritime maintenance leaders, this capability is practical rather than theoretical. The discipline required to freeze scope, manage a constraint, analyse variation, control approvals, and protect a re-float window is the same discipline used across healthcare, logistics, finance, manufacturing, and IT.
Lean 6 Sigma Hub offers CSSC-accredited online Lean Six Sigma training, including practical case studies, templates, simulations, and self-paced learning. Professionals ready to lead improvement work can explore the Lean Six Sigma Green Belt course, while those starting their journey can begin with White Belt training.
Enrol in Lean Six Sigma certification training and learn to map, analyse, and improve the operational systems that determine safety, reliability, cost, and delivery performance.
Kaizen. Kai-Care. Kai-Done. Lean Six Sigma