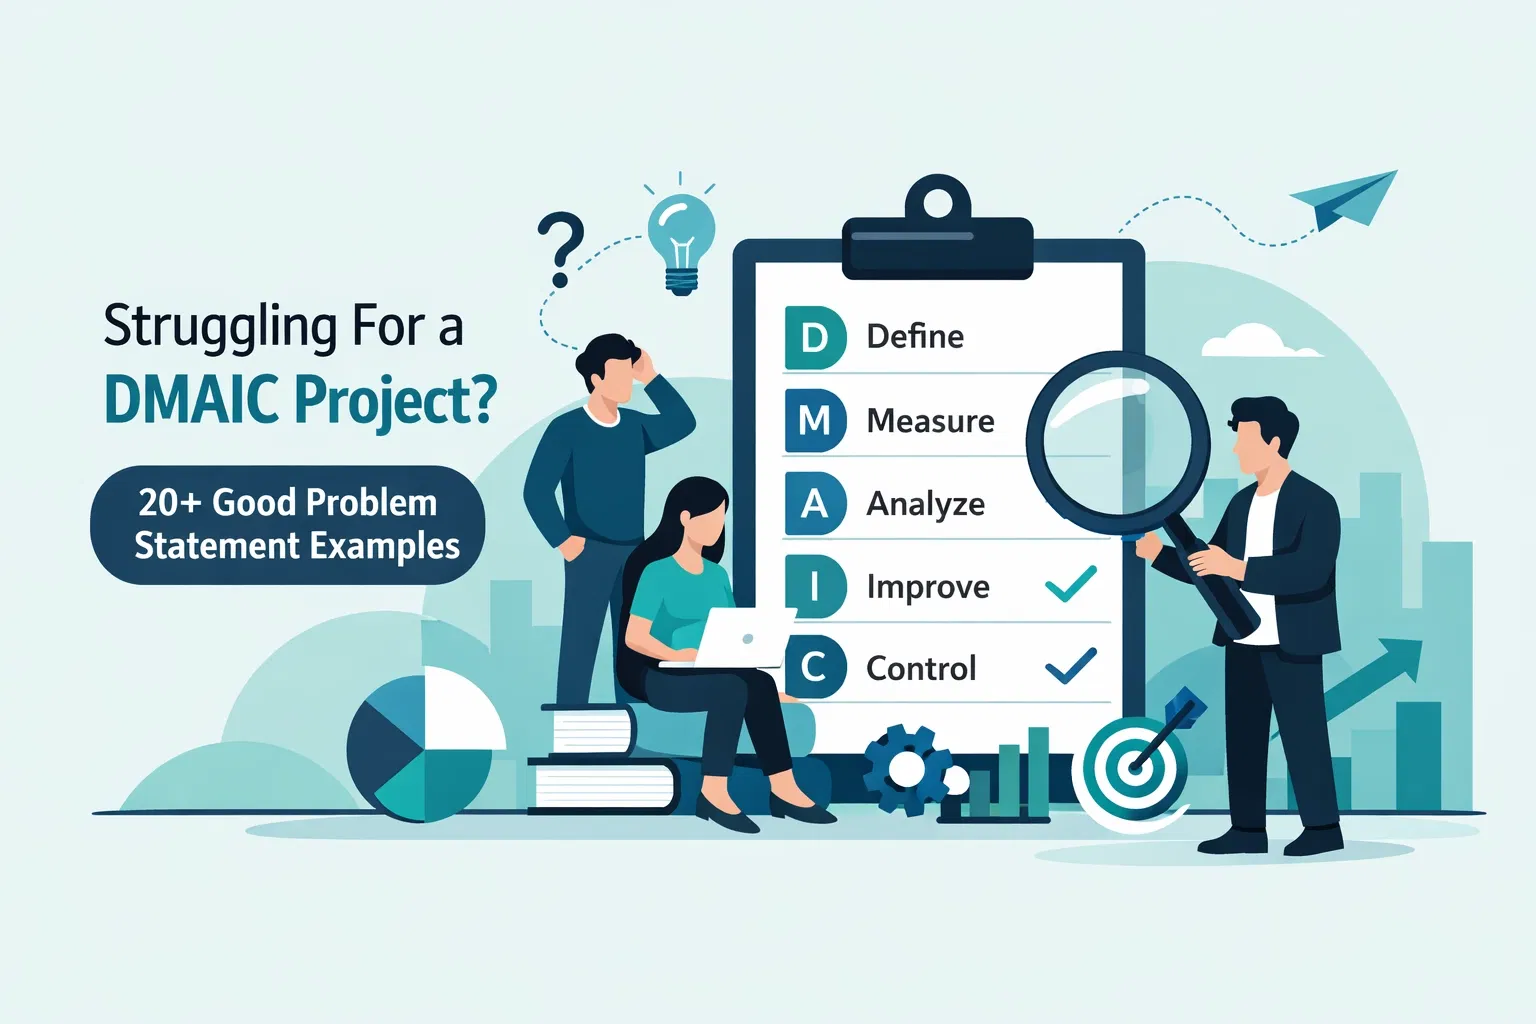
In the world of Lean Six Sigma, data is our north star. But data is rarely a perfect, symmetrical bell curve. If you’ve been spending any time in the Measure or Analyze phases of a DMAIC project, you’ve likely stared at a histogram or two and wondered, "Wait, why is it leaning that way?"
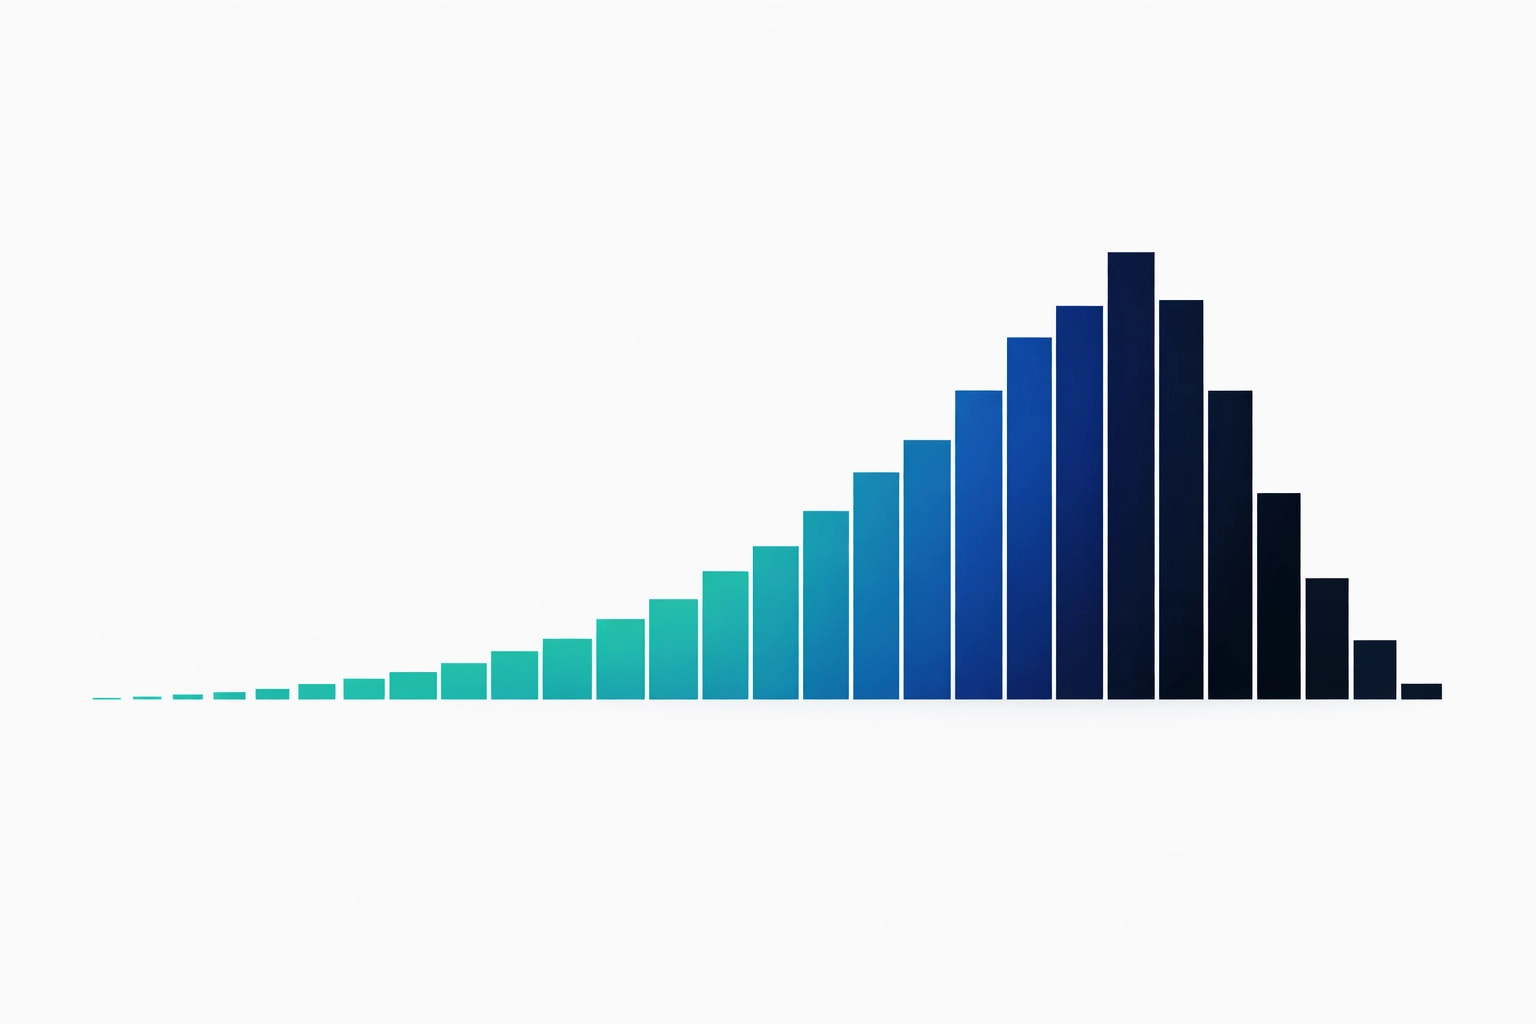
One of the most common: and often misunderstood: shapes you’ll encounter is the left-skewed histogram. In the realm of process improvement, understanding what is a left skewed histogram in Six Sigma is the difference between making an informed decision and chasing ghosts in your data.
At Lean 6 Sigma Hub, we see many Green and Black Belts get tripped up by skewness. Today, I’m going to break down exactly what a left-leaning tail means for your process, why it happens, and what you should do about it.
The Basics: What is a Left Skewed Histogram?
In technical terms, a left-skewed histogram is also known as a negatively skewed distribution.
If you look at the visual representation, the "mass" of the data is concentrated on the right side of the graph (the higher values), while a long "tail" stretches out toward the left (the lower values).
Think of it like a slide: the ladder is on the right, and the long slope goes down to the left.
When you encounter this in a Six Sigma project, it tells a very specific story: most of your process outputs are performing at a high level, but a few "bad apples" or outliers are dragging the overall performance down.
The Mathematics of the "Tail"
To truly appreciate what’s happening, we have to look at the three big measures of central tendency: the Mean, the Median, and the Mode.
- The Mode: This is the peak of your histogram. In a left-skewed distribution, the mode is the highest value because that’s where most of your data points live.
- The Median: This is the middle value. It sits to the left of the mode because those lower outliers are starting to pull the "middle" toward them.
- The Mean: This is the average. The mean is the most sensitive to outliers. Because of those few very low values in the left tail, the mean is "pulled" significantly to the left.
The Rule of Thumb: In a left-skewed distribution, the Mean < Median < Mode.
If you are calculating your process capability and you notice your average (mean) is much lower than your most frequent result (mode), you’re almost certainly dealing with negative skewness.
Why Does Left Skewness Happen?
Processes don't just decide to become skewed for no reason. In my experience leading LSS Black Belt sample projects, left skewness usually stems from one of two things: natural boundaries or significant process failures.
1. Natural Upper Boundaries
This is the most common reason. Some processes have a ceiling they simply cannot pass.
- Exams and Certifications: Imagine a Six Sigma Green Belt exam. Most students who study well will score between 80% and 100%. However, a few might score 20% or 30%. You can't score higher than 100%, so the data bunches up at the top and tails off to the left.
- Product Purity: If you are measuring the purity of a chemical, you can’t get higher than 100%. If your process is dialed in, most batches will be at 99%, but a few contaminated batches might drop to 70%.
2. The "Late Arrival" Scenario
In service industries, we often see this with deadlines. If a task is due on Friday, many people will turn it in on Friday or Thursday (the right side of the graph). Very few will turn it in two weeks early. This creates a left-leaning tail of those "early bird" data points.
3. Process Shifts and Outliers
Sometimes, left skewness is a warning sign. It might mean that while the process is generally stable, something is occasionally going catastrophically wrong. These outliers represent rare but significant quality failures. If you are using a dashboard design for process control, these are the points that trigger your red flags.
What a Green or Black Belt Should Do About It
If you’re a Lean Six Sigma professional, you can't just look at a skewed histogram and say "That’s interesting." You have to act. Here is the protocol I recommend for investigating negative skewness.
Step 1: Validate Your Data
Before you start sounding the alarm, check the data quality. Did someone enter a "0" instead of a "90"? Sometimes, the left tail isn't a process issue; it's a data entry issue. If you’re unsure, you can check out our free Six Sigma calculator to help run some quick checks on your distribution.
Step 2: Use the Median, Not Just the Mean
As we discussed, the mean is "poisoned" by the outliers in a skewed distribution. If you report only the average, you’re giving a pessimistic view of the process. Tell the stakeholders the median and the mode as well to provide a balanced picture of what "normal" looks like.
Step 3: Hunt the Outliers (Root Cause Analysis)
The "tail" is where the gold is buried. As a Black Belt, your job isn't to fix the "clump" on the right: that part of the process is working! Your job is to find out why those few points fell into the left tail.
- Was it a specific machine?
- A specific shift?
- A raw material supplier issue?
Use a 6M root cause analysis or a Fishbone diagram to isolate the "Tail-Events."

Step 4: Re-evaluate Process Capability
Standard Cpk and Ppk calculations assume a normal (symmetrical) distribution. If your data is heavily skewed, your capability indices might be misleading. You may need to transform the data (like using a Box-Cox transformation) or use non-parametric methods to get an accurate reading of your process health.
Real-World Scenario: The Manufacturing "Purity" Case
Let’s look at a hypothetical project. Jvalin’s widgets are supposed to be 98% pure.
- 90% of the widgets are between 97% and 99% pure.
- 5% are at 95%.
- 5% are at 60% due to a cooling leak that happens once a month.
If Jvalin only looks at the average, the purity looks like 94%. He might try to "improve" the whole process to raise that average. But the process is actually great! The "bulk" is at 98%. The real problem is the cooling leak. By identifying the left skew, Jvalin saves time and money by fixing the leak instead of over-engineering an already functional process.
To help prioritize which "tail" issues to fix first, I often recommend using a Stakeholder Impact Assessment Calculator. It helps you see which outliers are hurting your customers the most.
AI vs. Human Analysis in 2026
It’s worth noting that as we move through 2026, the way we detect and handle skewness is changing. Modern AI tools can now flag skewness instantly and even suggest the most likely root causes based on historical patterns. However, as I discussed in our piece on AI vs Human Analysis, the AI can point to the tail, but it takes a human Belt to walk onto the shop floor and understand the "why" behind the data.
Practical Tools to Master Histograms
If you are currently studying for your certification, don't let terms like "negative skewness" or "left-skewed" intimidate you. It’s just a way of describing where the outliers live.
To get some hands-on practice, I highly recommend checking out our Six Sigma flash cards. They’re a great way to drill these statistical concepts so they become second nature during your exams.
If you’re ready to prove your skills, you can also take our Free Lean Six Sigma Green Belt Practice Exam. It’s designed to test your ability to interpret real-world data scenarios exactly like the ones we’ve discussed today.
Conclusion
A left-skewed histogram isn't a "bad" graph. In fact, in many high-performing processes, it’s exactly what you want to see: a heavy concentration of success on the right with only a few outliers on the left.
As a Six Sigma practitioner, your value lies in your ability to look past the average and investigate the tail. By identifying why those low-value outliers exist, you can eliminate the "vital few" defects and push your process toward excellence.
Are you looking to master these statistical tools and take the next step in your career? Whether you’re just starting or looking to lead enterprise-wide changes, we have the training to get you there.
Enroll in our CSSC-Accredited Lean Six Sigma Training today and start leading data-driven change!