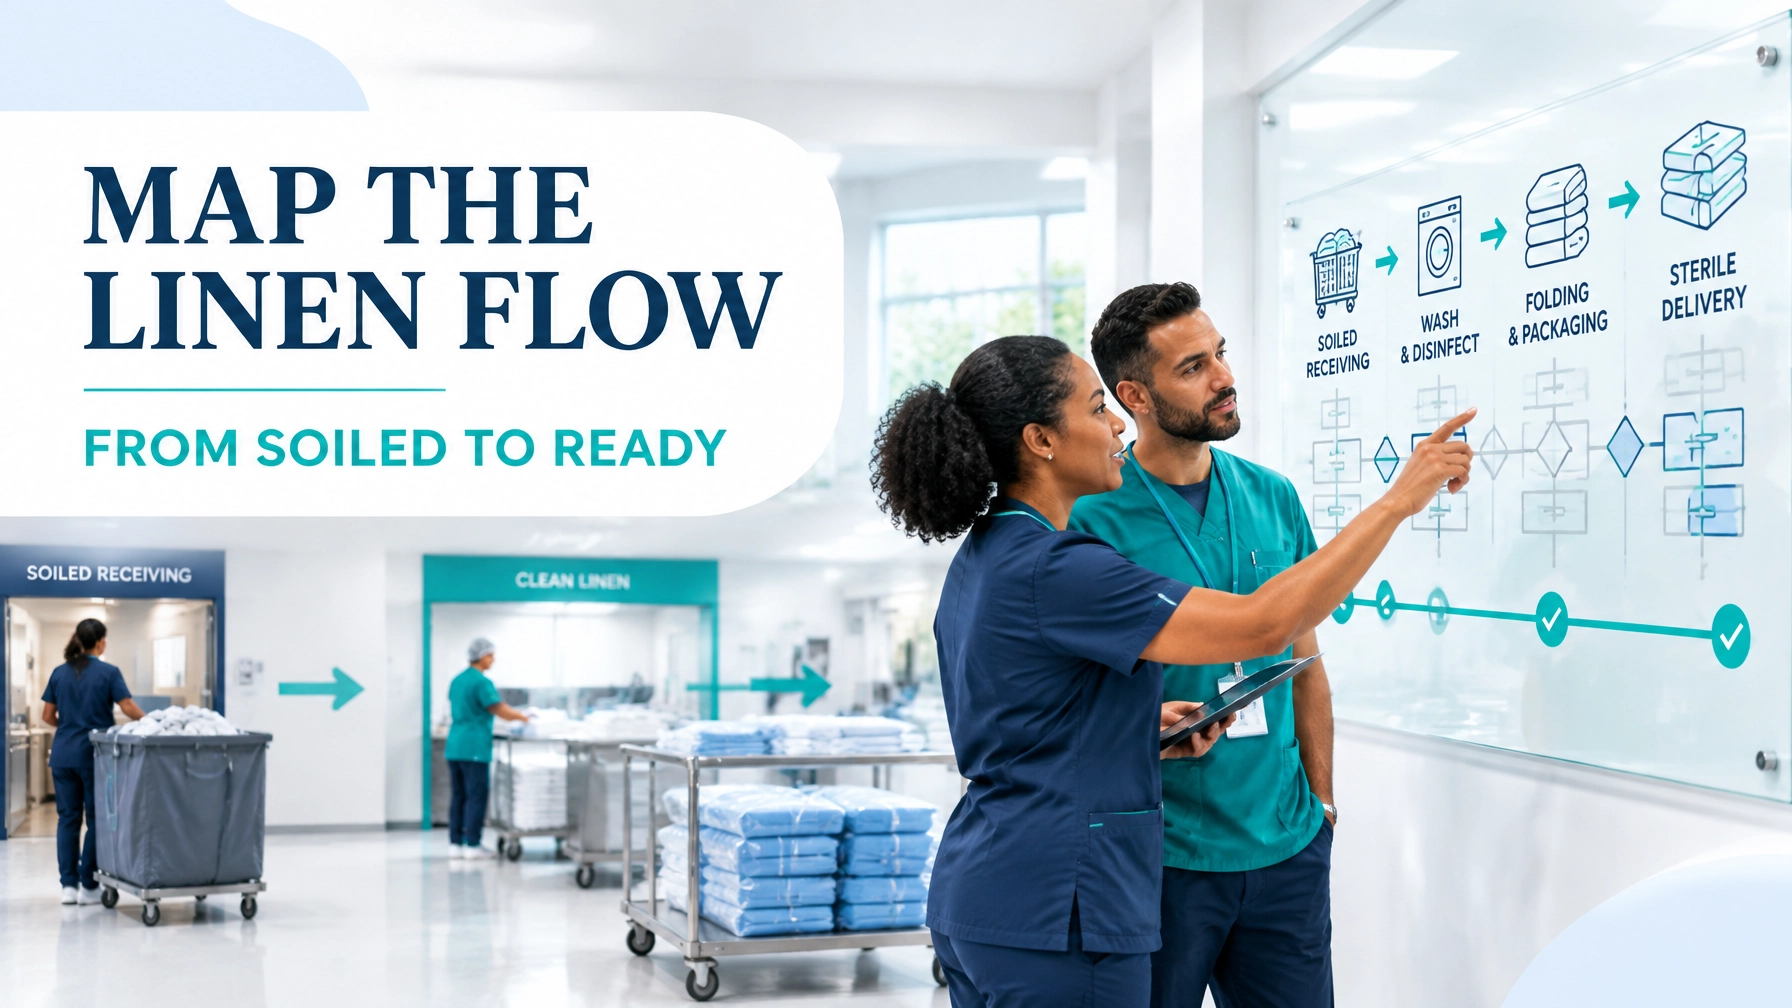
Healthcare laundry is a high-volume value stream with a direct influence on infection prevention, clinical readiness, operating-room continuity, staff workload, and patient experience. When linen is unavailable at the point of use, the consequence is not merely an inventory inconvenience. It can create emergency transport, delayed procedures, unplanned substitutions, and avoidable pressure on clinical teams.
Value Stream Mapping (VSM) provides a structured way to see the entire journey: from the moment linen becomes soiled to the point at which clean linen is available at the required PAR level. It exposes both material flow and information flow, making hidden queues, weak replenishment signals, and bottlenecks visible.
The following deep guide uses an illustrative hospital laundry example to show how to map the current state, quantify waste, and design a future state that improves flow without compromising safety or quality.
1. Define the Value Stream and Scope
The fundamental purpose of a value stream is to connect every activity required to deliver what the customer needs. In this case, the customers include patients, nurses, operating-room teams, sterile services, materials management, and hospital leadership.
For this example, the scope is:
- Start: Soiled reusable linen is placed into a correctly labelled collection bag on an inpatient ward or operating-room area.
- End: Clean linen is delivered and replenished to the ward or operating-room PAR level.
- Product family: Standard inpatient linen and reusable operating-room textiles.
- Related interface: Sterile textile sets are transferred to CSSD for validated inspection, wrapping, sterilisation, and release where required.
This distinction matters. A laundry process can produce clean linen, while sterile status may require a separate, validated CSSD process. The VSM should show that handoff clearly rather than treating “clean” and “sterile” as interchangeable outcomes.
A cross-functional mapping team should include laundry operators, porters, ward representatives, operating-room staff, CSSD, materials management, quality, and a Lean Six Sigma practitioner.
2. Map the Current State at the Gemba
Start by observing the process where the work happens. Do not rely only on policy documents or scheduled times. Record what actually happens across different shifts, demand periods, and linen categories.
A practical current-state flow is:
Soiled collection → Internal transport → Receiving and sorting → Washing → Drying → Folding and finishing → CSSD interface, if applicable → Clean storage → Ward delivery → PAR replenishment

Above the process boxes, map information such as:
- Ward collection schedules
- Linen requests and emergency calls
- Laundry production schedules
- PAR levels and reorder points
- CSSD release documentation
- Delivery routes and cut-off times
Below each process box, capture:
- Cycle time
- Waiting time
- Queue or Work in Process (WIP)
- Number of staff
- Available equipment time
- Defect, rewash, or rejection rate
- First Pass Yield (FPY)
A VSM should also identify the Voice of the Customer. For clinical users, critical-to-quality requirements may include “available when needed,” “correct linen type,” “clean and intact,” “sterile when specified,” and “delivered without unplanned escalation.”
The Voice of the Process comes from actual data. The Voice of the Business may include labour utilisation, water and energy consumption, transport cost, linen replacement cost, and compliance performance. The future state must balance all three.
For more detail on separating value-added from non-value-added work, see Value-Added vs Non-Value-Added Analysis.
3. Worked Current-State Example
Assume a 450-bed hospital processes 1,200 linen pieces per day, including sheets, gowns, towels, and operating-room textiles. Available laundry time is 900 minutes per day.
Daily demand is:
[
\text{Takt Time} = \frac{900 \text{ available minutes}}{1,200 \text{ pieces}} = 0.75 \text{ minutes per piece}
]
The operation uses batch equipment, so takt time is a demand rhythm rather than an individual machine cycle. It helps the team compare effective capacity with demand and identify the constraining step.
A five-day observation produces the following average:
| Process step | Cycle time | Average waiting time | Queue/WIP | Key observation |
|---|---|---|---|---|
| Soiled collection and transport | 18 min | 95 min | 42 bags | Fixed collection rounds create long waits |
| Receiving and sorting | 34 min | 140 min | 85 bags | Mixed labels require re-sorting |
| Washing | 42 min | 185 min | 9 loads | Washer availability is the main constraint |
| Drying | 28 min | 62 min | 4 loads | Partial loads and re-drying occur |
| Folding and finishing | 36 min | 75 min | 1,100 pieces | Work is released in large batches |
| CSSD transfer and release | 22 min | 120 min | 6 sets | Handoff and approval queue |
| Clean storage and delivery | 25 min | 160 min | 1.8 days of stock | PARs are based on historical orders |
Total processing time is:
[
18+34+42+28+36+22+25 = 205 \text{ minutes}
]
Total lead time, including waiting, is:
[
205+(95+140+185+62+75+120+160)=1,042 \text{ minutes}
]
The process cycle efficiency is therefore:
[
\text{PCE}=\frac{205}{1,042}\times100=19.7%
]
Only about one-fifth of the elapsed time involves active processing. The remaining time is predominantly waiting, queue movement, inventory holding, and handoff delay.
4. Identify the Eight DOWNTIME Wastes
The VSM should convert observations into specific improvement opportunities. Use the eight DOWNTIME categories:
- Defects: Incorrect segregation, damaged linen, failed inspections, and rewash.
- Overproduction: Processing linen to a fixed schedule rather than actual PAR consumption.
- Waiting: Bags awaiting collection, loads awaiting washers, and CSSD sets awaiting release.
- Non-utilised talent: Operators spending time searching for carts, reconciling paperwork, or correcting avoidable labelling errors.
- Transportation: Repeated movement between holding areas, laundry zones, storage, and wards.
- Inventory: Excess clean stock in some wards while critical areas experience shortages.
- Motion: Unnecessary walking to retrieve labels, carts, scanners, or packaging.
- Extra-processing: Double counting, duplicate approvals, repeated folding, and manual reconciliation of inconsistent requests.
The most important insight is that a visible shortfall may be caused by an upstream problem. A ward stockout can result from variation in demand, a washer bottleneck, delayed CSSD approval, or an inaccurate PAR: not simply insufficient linen.
A box plot of delivery lead time can reveal the median, spread, skewness, and outliers. Attribute data such as delivered on time: Pass/Fail can monitor service reliability. An X-bar chart paired with an R chart can show whether average delivery time and within-day variation are stable.
5. Build the Future-State Map

The future state should establish a controlled pull system wherever continuous flow is impractical. Recommended design choices include:
-
Standardise point-of-use segregation
Use colour-coded bags, clear labels, and defined rules for linen type, risk category, and operating-room textiles. -
Create a washer pacemaker
Schedule the constrained washing process against demand, equipment availability, and required delivery windows. -
Reduce batch size
Move from large release batches to smaller FIFO loads, especially for high-demand inpatient and operating-room categories. -
Use PAR-based replenishment
Set minimum, maximum, and reorder quantities by ward. Replenish to the agreed PAR rather than repeating historical order quantities. -
Introduce visual signals
A Kanban card, electronic trigger, or marked shelf can signal when stock falls below the reorder point. An Andon-style alert can escalate a washer outage, failed sterilisation cycle, or urgent stock risk in real time. -
Simplify approvals
Governance checkpoints are necessary for safety and traceability, but excessive approval layers can create bottlenecks. Define which decisions require formal approval and which can follow standard work. -
Protect sterile interfaces
Use a documented handoff between laundry and CSSD, with clear release criteria, status visibility, and escalation rules.
The future state should also reflect Y = f(x) thinking: linen availability, delivery reliability, and rework are outputs influenced by inputs such as bagging accuracy, washer uptime, batch size, demand data, PAR settings, and release discipline.
6. Current Versus Future Performance
| Metric | Current state | Future-state target |
|---|---|---|
| Total lead time | 1,042 min | 420 min |
| Active processing time | 205 min | 190 min |
| Process cycle efficiency | 19.7% | 45.2% |
| Average clean-linen WIP | 1,100 pieces | 500 pieces |
| Emergency ward requests | 18 per week | 6 per week |
| Rewash or re-sort rate | 7.5% | 3.0% |
| On-time PAR replenishment | 86% | 98% |
| Clean-stock coverage | 1.8 days | 1.2 days |
| Washer utilisation | 68% | 82% |
The objective is not to remove every buffer. Healthcare requires controlled safety stock and resilient contingency planning. The objective is to make inventory intentional, visible, and connected to demand.
7. Sequence the Kaizen Work

Sequence improvements so that each change creates stability for the next:
- Stabilise: Confirm definitions, collect baseline data, verify measurement reliability, and standardise bagging and labelling.
- Relieve the bottleneck: Analyse washer capacity, changeover time, downtime, and load utilisation.
- Improve flow: Establish FIFO lanes, reduce batch sizes, and redesign the physical route.
- Create pull: Recalculate PAR levels using demand, replenishment lead time, and an agreed safety factor.
- Strengthen information flow: Introduce visual signals and a daily escalation board.
- Pilot: Test the future state in one ward and one linen family for two to four weeks.
- Control: Monitor FPY, stockouts, emergency requests, lead time, and on-time delivery using a control plan.
- Scale: Extend the standard to other wards, operating rooms, and CSSD interfaces.
Agile practices can complement this work through short improvement cycles, rapid feedback, and incremental testing. The DMAIC structure provides governance, while Agile iterations help the team learn quickly without waiting for a large one-time implementation.
8. Turn the Map into Capability
A VSM becomes valuable when it changes decisions at the gemba. Train team members to distinguish waiting from processing, inventory from availability, and activity from customer value. A Yellow Belt can support data collection and local improvements; a Green Belt can lead the cross-functional project; and a Black Belt can guide advanced analysis, capability studies, and sustained control.
Lean 6 Sigma Hub’s CSSC-accredited Green Belt Online Training develops these capabilities through self-paced learning, practical case studies, process mapping, data analysis, and control planning. You can also explore the Lean Six Sigma Practitioner Guide and the guide to Time and Motion Studies.
Start mapping your healthcare laundry value stream, quantify the waiting, and pursue Lean Six Sigma certification to lead measurable improvements in flow, reliability, and patient-centred service.
Kaizen. Kai-Care. Kai-Done. ( Lean Six Sigma)