In food manufacturing, efficiency is inseparable from freshness, food safety, traceability and yield. A delay at receiving can hold an entire production schedule. A poorly sequenced allergen changeover can consume an entire shift. A small filling error, repeated thousands of times, can become a substantial giveaway or customer-quality problem.
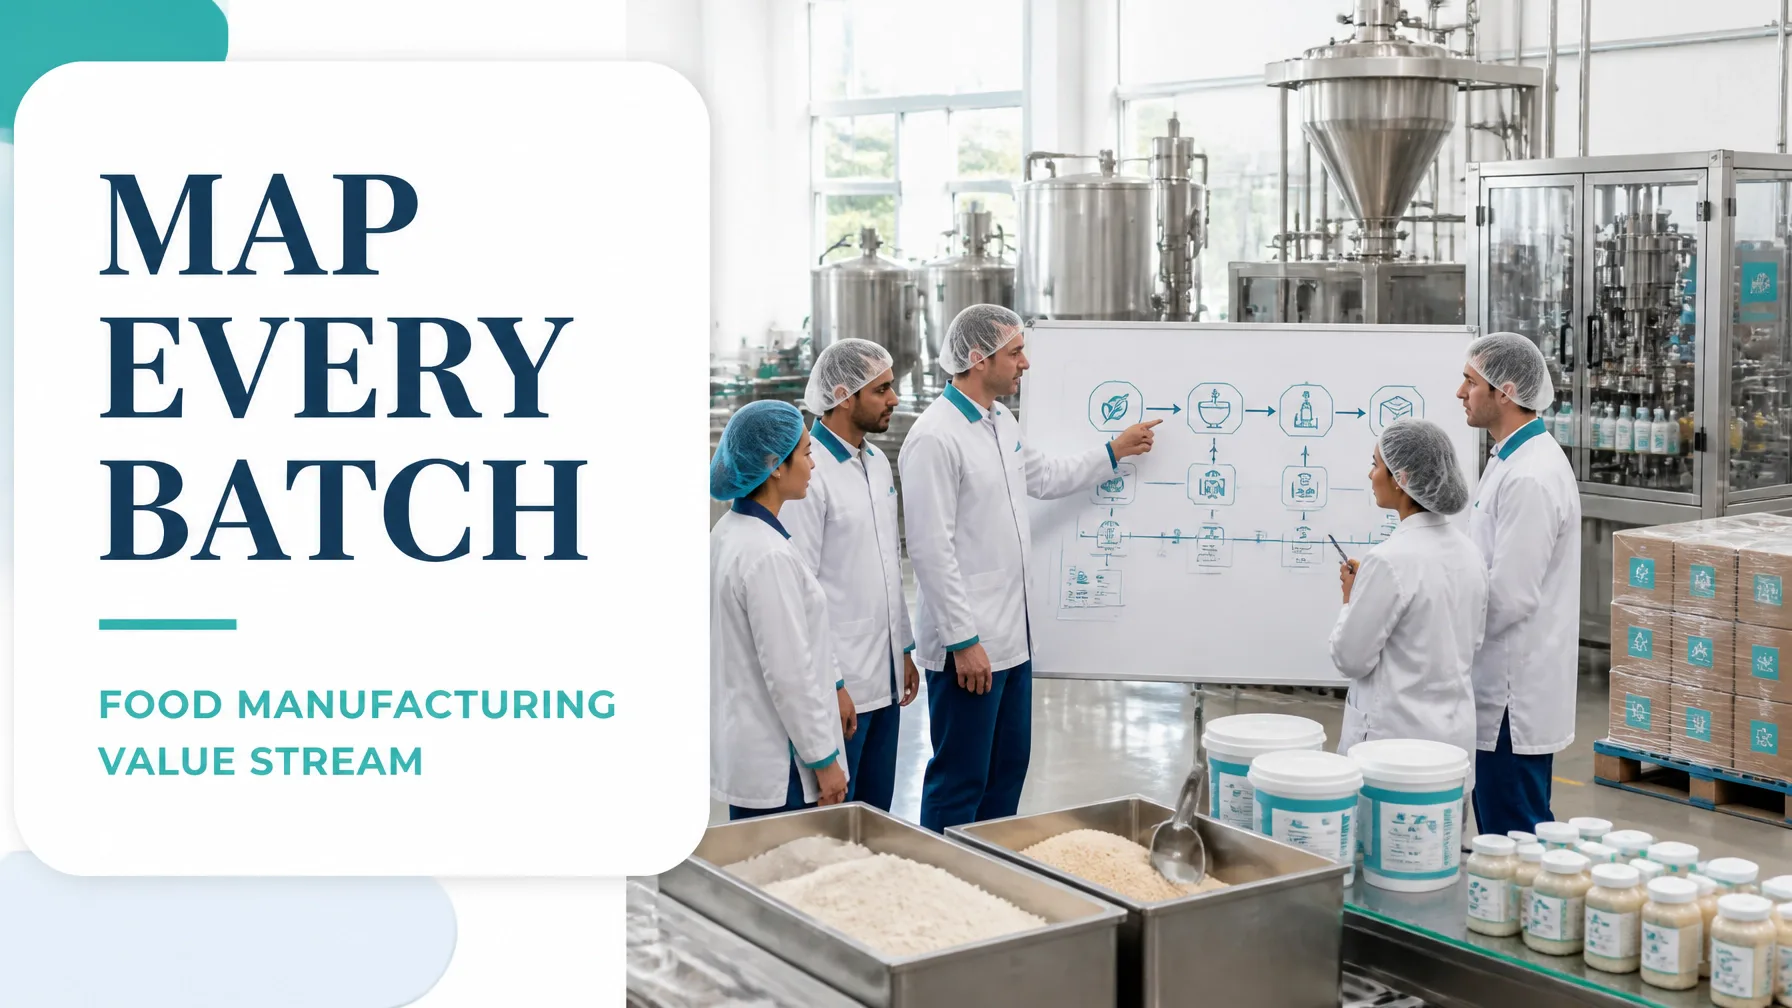
Value stream mapping (VSM) provides a structured way to see these relationships. Instead of analysing one machine or department in isolation, it traces the complete flow of materials and information: from raw material intake through batching, processing, packaging, cold storage and dispatch.
For food and beverage manufacturers, VSM is particularly powerful because it makes hidden losses visible: sanitation downtime, quality holds, ingredient waiting, work in process, yield loss, rework and dispatch delays. When combined with Lean Six Sigma training, OEE, TPM and SMED, it becomes a practical system for improving flow without compromising food safety.
Why Food Processing Lines Have Unique Sources of Waste
The fundamental purpose of VSM is to compare what creates customer value with what consumes time, capacity, space or material without increasing that value. Food production adds several industry-specific complications:
- Perishability: Ingredients and finished products may have limited shelf life.
- Allergen controls: Product sequencing and validated cleaning requirements can extend changeovers.
- Sanitation: Cleaning is essential, yet poorly designed sanitation routines can create excessive downtime.
- Yield loss: Trimming, evaporation, spillage, overfill and off-specification batches directly reduce profitability.
- Batch constraints: Recipes, thermal processes and minimum run sizes can restrict one-piece flow.
- Cold-chain requirements: Products may wait for chilling, quality release, warehouse space or refrigerated transport.
- Traceability: Every ingredient lot must remain connected to the relevant batch and finished product.
A successful map therefore includes more than processing steps. It must also capture quality approvals, laboratory release, maintenance, sanitation, inventory, information flow and hold-and-release decisions.
The Lean Enterprise Institute’s overview of value stream mapping provides the broader Lean foundation. In a food plant, that foundation must be adapted to reflect regulatory controls and physical product characteristics.
Mapping the Current State From Intake to Dispatch
Begin with a defined product family rather than attempting to map every SKU simultaneously. For example, select chilled ready meals that use similar ingredients, equipment and packaging formats.
Set the boundaries from:
- Raw material receiving and inspection
- QA sampling and ingredient release
- Storage, tempering and staging
- Weighing, batching and mixing
- Cooking, thermal treatment or chilling
- Filling, sealing and labelling
- Metal detection, inspection and packing
- Palletising and finished-goods storage
- QA release and refrigerated dispatch
Walk the process at the gemba and record actual observations. For each process box, capture:
- Batch size and frequency
- Cycle time
- Number of operators
- Changeover and sanitation duration
- Planned and unplanned downtime
- Availability, performance and quality
- First-pass yield and rework
- Scrap, giveaway and ingredient loss
- WIP before and after the process
- Waiting for materials, QA, equipment or cold storage
- Information received from planning, quality and logistics
Add ingredient lot codes, batch identifiers, rework loops and disposal points to the map. This turns VSM into a visual traceability model rather than a simple production-flow diagram.

Worked Example: A Chilled Ready-Meal Line
Consider a hypothetical chilled ready-meal facility supplying 10,000 trays per day across two shifts. After scheduled breaks, the line has 900 minutes of planned production time available each day.
The current-state investigation identifies the following conditions:
- Five production batches of approximately 2,000 trays
- Average recipe changeover: 45 minutes
- Four changeovers per day: 180 minutes
- Sanitation and allergen-cleaning downtime: 60 minutes
- Breakdown and minor-stop losses: 30 minutes
- Total filler downtime: 270 minutes
- Actual operating time: 630 minutes
- Ideal filler cycle: 0.065 minutes per tray
- Total output: 9,000 trays
- Good output: 8,280 trays
- Ingredient-to-good-product yield: 94.5%
- WIP before filling: 2,400 trays
- Average cold-chain wait before dispatch: 6 hours
For the filler, the OEE calculation is:
- Availability: 630 ÷ 900 = 70.0%
- Performance: (0.065 × 9,000) ÷ 630 = 92.9%
- Quality: 8,280 ÷ 9,000 = 92.0%
- OEE: 70.0% × 92.9% × 92.0% = 59.9%
The OEE result is not a judgement about the operators. It is a signal that the line’s available capacity is being consumed by changeovers, sanitation, equipment losses and quality defects.
The map also reveals a significant lead-time imbalance. Total value-adding processing may take approximately 165 minutes, while the product spends around 31 hours moving through queues, storage, release holds and cold-chain waiting. The resulting process cycle efficiency is only:
165 ÷ 1,860 minutes = 8.9%
Use the Process Cycle Efficiency Calculator to structure this calculation for your own process.
Finding the Bottleneck With Takt, OEE and WIP
Customer demand is 10,000 trays per day, so takt time is:
Takt time = 900 available minutes ÷ 10,000 trays = 0.09 minutes per tray, or 5.4 seconds
The filler’s ideal cycle is below takt, but actual performance is affected by stops and speed losses. The packing step averages 6.2 seconds per tray, which is slower than the 5.4-second takt. This creates an accumulation of WIP before packing.
Three symptoms confirm that packing is the constraint:
- WIP accumulates directly upstream.
- Finished meals wait for packing capacity rather than customer demand.
- The packing station has the lowest effective capacity after accounting for changeovers and minor stops.
This is where OEE and Theory of Constraints complement VSM. The constraint should receive priority for improvement because increasing output elsewhere may simply create more WIP.
A Cost of Poor Quality Calculator can also help quantify the financial effect of rejected trays, rework, giveaway, disposal and customer complaints.
The Eight Wastes in Food Manufacturing
The eight DOWNTIME wastes appear in distinctive food-industry forms:
- Defects: Incorrect labels, seal failures, microbial failures, underweight trays and off-specification batches. Spoilage is a particularly costly form of defect because it can affect both material and finished-product value.
- Overproduction: Manufacturing ahead of demand, producing excessive safety stock or making large batches that increase expiry risk.
- Waiting: Ingredients waiting for QA release, operators waiting for equipment, products waiting to chill, and finished goods waiting for refrigerated transport.
- Non-utilised talent: Operators’ practical knowledge is excluded from changeover design, sanitation improvement or root-cause analysis.
- Transportation: Repeated movement between raw-material stores, thawing areas, production rooms, quarantine zones and cold stores.
- Inventory: Excess ingredients, packaging materials, WIP and finished goods that consume space and may approach expiry.
- Motion: Unnecessary walking to collect labels, tools, cleaning equipment or quality paperwork.
- Extra-processing: Duplicate checks, repeated data entry, excessive handling, over-cleaning beyond validated requirements or inspections that do not influence a decision.
Food manufacturers should explicitly mark spoilage, giveaway and disposal on the map. These losses can be hidden when teams measure only labour time or machine uptime.
Designing the Future-State Map
The future state should improve flow while preserving validated food-safety controls. In this example, the team introduces three major changes.
1. Smaller batches and leveled scheduling
The facility moves from five batches of 2,000 trays to eight batches of approximately 1,500 trays. This reduces queue size and allows production to respond more closely to the daily demand pattern.
A leveled schedule sequences products by allergen, colour, recipe complexity and packaging format. The objective is not to eliminate every changeover. It is to make changeovers predictable, shorter and strategically sequenced.
2. SMED changeover reduction
A cross-functional kaizen event separates internal and external setup work:
- Pre-stage ingredients, labels, tooling and cleaning materials.
- Prepare documentation before the line stops.
- Use quick-release connections and preset equipment settings.
- Standardise first-off verification.
- Assign parallel sanitation and maintenance roles.
- Record changeover time from last good product to first good product.
The target reduces average changeover time from 45 minutes to 18 minutes. Although the future state contains more production batches, total changeover loss falls because each transition is substantially shorter.
3. TPM for the constraint
The packing station receives a focused Total Productive Maintenance (TPM) programme:
- Daily operator inspection of belts, sensors, guides and sealing surfaces
- Planned maintenance during non-production windows
- Centreline settings for each packaging format
- Pareto analysis of recurring stops
- Condition checks for conveyors and label-application equipment
- Standard escalation when a minor stop repeats
TPM changes maintenance from reactive restoration to proactive reliability management. VSM shows where that reliability matters most: at the process constraining total flow.

Current-State Versus Future-State Metrics
| Metric | Current state | Future state | Improvement |
|---|---|---|---|
| Average batch size | 2,000 trays | 1,500 trays | More responsive flow |
| Changeover duration | 45 min | 18 min | 60% reduction |
| Total changeover loss | 180 min/day | 126 min/day | 54 min recovered |
| Sanitation downtime | 60 min/day | 30 min/day | 50% reduction |
| Breakdown/minor-stop loss | 30 min/day | 12 min/day | 60% reduction |
| Filler availability | 70.0% | 87.3% | +17.3 points |
| Filler performance | 92.9% | 95.1% | +2.2 points |
| Filler quality | 92.0% | 98.0% | +6.0 points |
| Filler OEE | 59.9% | 81.4% | +21.5 points |
| Ingredient-to-good yield | 94.5% | 97.0% | +2.5 points |
| WIP before filling | 2,400 trays | 900 trays | 62.5% reduction |
| Cold-chain waiting | 6 hours | 2 hours | 66.7% reduction |
| Total lead time | 31 hours | 17 hours | 45.2% reduction |
| Process cycle efficiency | 8.9% | 14.7% | Significant improvement |
The future-state OEE calculation is:
- Availability: 786 ÷ 900 = 87.3%
- Performance: (0.065 × 11,500) ÷ 786 = 95.1%
- Quality: 98.0%
- OEE: 87.3% × 95.1% × 98.0% = 81.4%
These figures are hypothetical, but they demonstrate how a VSM project connects operational actions to measurable outcomes.
Linking VSM to TPM and Kaizen Events
A map should not remain a wall display. Convert the future state into an implementation plan with named owners, dates and control measures.
Prioritise actions that affect the constraint:
- Run a SMED event on the longest allergen changeover.
- Establish autonomous maintenance at the packing station.
- Reduce QA release waiting through digital batch records and defined response times.
- Investigate the top three yield-loss causes using DMAIC.
- Install a FIFO-controlled refrigerated supermarket before dispatch.
- Review OEE, yield, WIP and cold-chain waiting weekly.
Use kaizen events for focused, short-cycle improvements, then use Lean Six Sigma analysis when the causes are complex or statistically variable. Your Lean Six Sigma Practitioner Guide can support the broader improvement framework.
The most effective food-manufacturing teams combine frontline knowledge with disciplined measurement. VSM identifies where the system loses flow; TPM protects equipment reliability; SMED releases capacity; and Lean Six Sigma confirms whether the changes produce sustained results.
Build Capability With Lean Six Sigma Training
Value stream mapping in food manufacturing is not merely a drawing exercise. It is a method for connecting ingredient flow, batch logic, sanitation, quality, OEE, yield and customer demand in one operational view.
When your team can distinguish value-added processing from waiting, identify the true constraint and quantify the cost of poor quality, improvement discussions become more precise: and investment decisions become easier to justify.
Build the capability to lead data-driven improvement projects with accredited, self-paced Lean Six Sigma training and certification from Lean 6 Sigma Hub.
Kaizen. Kai-Care. Kai-Done. ( Lean Six Sigma)