A value stream map is only as useful as the method behind it. A polished diagram built from assumptions can create false confidence; a simple hand-drawn map based on observed facts can reveal the real constraints in a process.
Value Stream Mapping (VSM) makes the complete flow visible: from customer demand and information signals to material movement, processing, queues, and delivery. In the realm of Lean Six Sigma, it provides a system-level view before the team targets individual causes or introduces solutions. The objective is not to produce attractive artwork. The objective is to understand the current state, design a credible future state, and create a practical route between them.
This guide explains how to create a value stream map in eight steps, using an illustrative medical-device kitting process to demonstrate the method.
The Worked Case: Crestline Medical Kits
Crestline Medical assembles procedure kits for hospitals. The selected product family contains three kit variants that share the same major process steps:
- Component picking
- Kit assembly
- Final inspection
- Packing and dispatch
The operation works one shift per day, with 420 available production minutes. Customer demand is 240 kits per day, so the initial takt-time calculation is:
Takt time = Available production time ÷ Customer demand
420 minutes ÷ 240 kits = 1.75 minutes per kit
The process currently delivers on time only 82% of the time, while WIP accumulates between nearly every major step.
Step 1: Choose the Product Family Using a Product-Quantity Matrix
Do not begin by mapping every product or service in the organisation. First, identify a product family: a group of products or services that pass through similar process steps and resources.
Create a product-quantity matrix showing:
- Product or service type
- Annual or monthly volume
- Shared process steps
- Dedicated equipment or specialist work
- Customer significance
- Current performance concerns
For Crestline, the matrix showed that 74% of monthly demand came from three standard procedure kits. Those kits used the same picking, assembly, inspection, and packing pathway. Custom kits followed a different route and were excluded from the first map.
This decision made the project manageable while preserving meaningful business impact. A strong product-family choice should be large enough to matter and focused enough to map accurately.
Step 2: Define the Scope and Customer Expectations
Set clear boundaries before collecting data. Write down:
- The starting point
- The end point
- The customer
- The product or service family
- The demand period
- The performance problem being investigated
For this case, the scope was:
From release of a confirmed customer order to dispatch of a finished medical kit.
The customer expectation was 240 kits per day, with a delivery reliability target of at least 98%.
Calculate takt time using actual available time rather than theoretical opening hours. If the shift lasts 480 minutes but includes 60 minutes for breaks, meetings, and planned maintenance, available time is 420 minutes.
Takt time is not the same as cycle time. Takt sets the required rhythm based on demand; cycle time describes how quickly a process step currently produces.
Step 3: Go to the Gemba and Walk the Actual Flow

A gemba walk means going to the place where the work occurs and observing the process directly. Do not rely solely on SOPs, process maps, interviews, or ERP reports. Those sources may describe the intended process rather than the process people actually follow.
Walk from the customer end upstream, following one order or product through the complete flow. Ask neutral questions such as:
- What triggers this step?
- Where does the work wait?
- What information is required?
- What happens when the information is incomplete?
- How is priority decided?
- What causes rework or escalation?
- Who owns the handoff?
For Crestline, the documented process showed a smooth sequence. The gemba walk revealed that:
- Picking batches were released twice daily rather than continuously.
- Assembly waited for printed labels from a separate office.
- Inspection created a queue because only one qualified inspector was available.
- Packing often worked from a daily spreadsheet rather than a live pull signal.
Record facts without assigning blame. The current state map should reflect the system as it operates today.
Step 4: Collect Process Data for Every Major Step
Each major process box needs a data box containing consistent, observable measures. At minimum, collect:
- Cycle time
- Changeover time
- Uptime or availability
- Batch size
- WIP quantity
- First-pass yield
- Number of operators
- Queue or waiting time
A representative Crestline data set looked like this:
| Process step | Cycle time | Changeover | Uptime | Batch size | WIP before step | First-pass yield |
|---|---|---|---|---|---|---|
| Component picking | 1.3 min | 18 min | 92% | 120 kits | 360 kits | 99.2% |
| Kit assembly | 2.4 min | 12 min | 96% | 60 kits | 192 kits | 97.5% |
| Final inspection | 1.1 min | 5 min | 88% | 48 kits | 144 kits | 96.8% |
| Packing and dispatch | 1.4 min | 8 min | 94% | 48 kits | 96 kits | 99.5% |
The assembly cycle time of 2.4 minutes exceeded the takt time of 1.75 minutes, immediately identifying a capacity gap. However, do not treat this observation as proof of the root cause. It is a signal that requires further analysis.
Also distinguish between processing time and waiting time. A kit may receive only six minutes of hands-on work yet remain in the system for several days.
Step 5: Draw the Current State Map with Standard Symbols

Start with pencil, paper, sticky notes, or a whiteboard. The first version should be easy to correct.
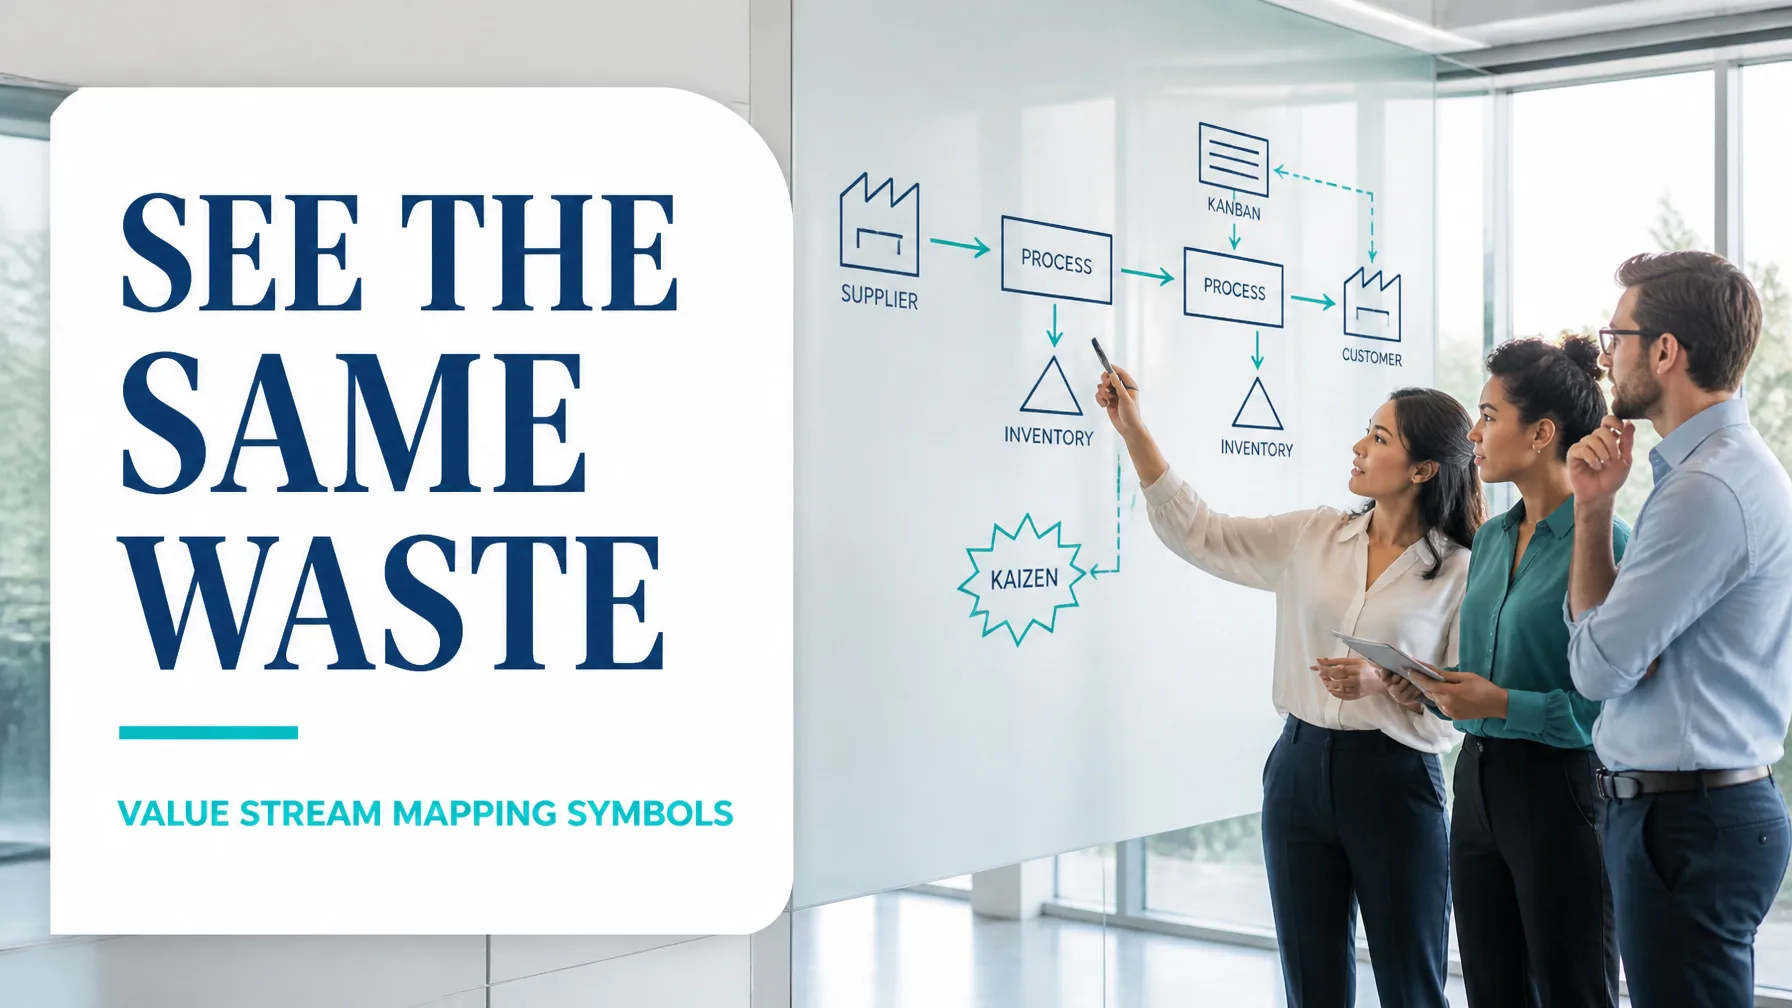
Common VSM symbols include:
- Customer and supplier icons: external demand and supply points
- Process box: a major transformation step
- Data box: cycle time, uptime, yield, batch size, and other process facts
- Inventory triangle: WIP or finished inventory between steps
- Solid material-flow arrow: movement of physical product
- Information-flow arrow: schedules, orders, forecasts, emails, or system signals
- Production-control box: planning, scheduling, or order-release activity
- Push arrow: work released based on a schedule or forecast
- Pull or kanban symbol: downstream demand authorising replenishment
- FIFO lane: controlled first-in, first-out flow
- Supermarket: a controlled inventory point used to support pull
- Kaizen burst: an improvement opportunity requiring focused action
- Timeline: value-added and waiting time beneath the map
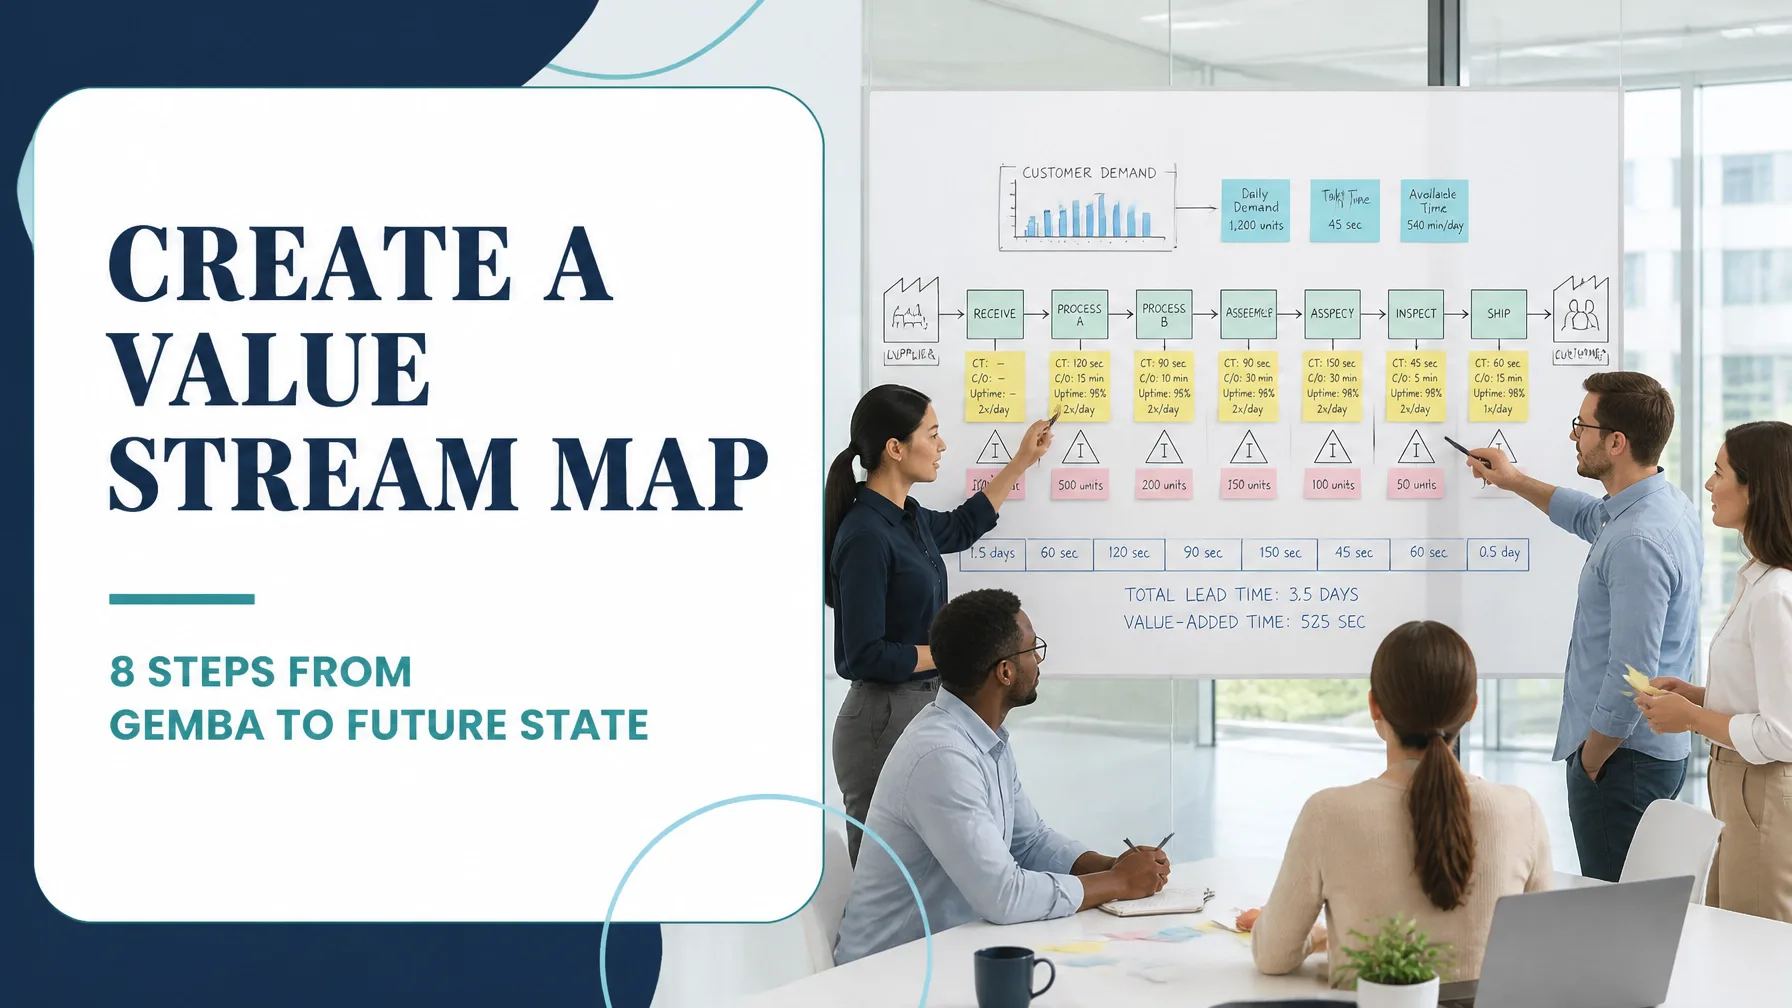
Make information flow visible above the process and material flow visible below it. For Crestline, the current state map showed hospital demand flowing to customer service, then to production planning. Planning issued a daily schedule to picking, assembly, inspection, and packing. Material moved through large batches, with inventory triangles between each step.
A current state map should be factual, not aspirational.
Step 6: Calculate the Timeline and Value-Added Ratio
The timeline quantifies the difference between work and elapsed time.
For Crestline, the observed WIP translated into the following waiting periods:
- Before assembly: 1.5 days
- Before inspection: 0.8 days
- Before packing: 0.6 days
- Dispatch scheduling: 0.4 days
Total waiting time was 3.3 calendar days.
The observed value-added processing time was:
1.3 + 2.4 + 1.1 + 1.4 = 6.2 minutes
Using 24 hours per calendar day:
3.3 days × 1,440 minutes = 4,752 waiting minutes
Therefore:
Total lead time = 4,752 + 6.2 = 4,758.2 minutes
The value-added ratio, also called process cycle efficiency, was:
Value-added ratio = Value-added time ÷ Total lead time × 100
6.2 ÷ 4,758.2 × 100 = 0.13%
This result does not mean the employees are unproductive. It means that the customer’s order spends almost all its time waiting, queuing, being scheduled, or moving between steps.
The VSM timeline therefore helps the team prioritise flow improvements rather than focusing only on individual cycle times.
Step 7: Analyse Waste and Design the Future State

Use the current state map to identify waste, constraints, and opportunities for improved flow. Examine:
- Excess WIP
- Waiting for approvals, labels, materials, or inspections
- Large production batches
- Rework loops
- Push scheduling
- Long changeovers
- Unbalanced workloads
- Duplicate information entry
- Bottlenecks and capacity constraints
Crestline’s future state design included:
- A supermarket between picking and assembly, replenished by a defined pull signal.
- A FIFO lane before inspection, limited to 24 kits.
- A second trained inspector during the peak release window.
- Smaller picking batches of 30 kits instead of 120.
- Standardised electronic label generation at the point of assembly.
- A short kaizen burst to rebalance assembly work.
- Daily demand levelling to prevent schedule spikes.
The target future-state numbers were:
| Metric | Current state | Future-state target |
|---|---|---|
| Total lead time | 3.3 days | 1.1 days |
| WIP across the stream | 792 kits | 192 kits |
| Value-added time | 6.2 min | 5.8 min |
| Value-added ratio | 0.13% | 0.37% |
| On-time delivery | 82% | 98% |
| Largest effective cycle time | 2.4 min | 1.5 min |
The future state map is not a wish list. Every proposed feature: pull, supermarket, FIFO, standard work, or staffing change: must have an owner, a measurable target, and a practical implementation path.
Step 8: Build the Implementation Plan and Track It
Convert the gap between current and future state into an action plan. Each action should include:
- Specific improvement
- Owner
- Due date
- Required resources
- Expected benefit
- Measure of success
- Risk or dependency
- Review date
A practical sequence for Crestline was:
- Confirm demand and takt time.
- Establish the FIFO limit before inspection.
- Trial smaller picking batches for one week.
- Standardise label generation.
- Rebalance assembly work.
- Introduce supermarket replenishment.
- Confirm training and audit requirements.
- Recalculate lead time, WIP, yield, and delivery performance.
Track the implementation with a visible board or project dashboard. Review results weekly during implementation, then move appropriate measures into the process control plan.
A future state map should eventually become the basis for standard work, visual management, daily performance reviews, and further kaizen.
Common Beginner Mistakes
Avoid these frequent errors when learning how to create a value stream map:
- Mapping too broad a scope: Start with one product family or service line.
- Using documented times: Observe actual cycle and waiting times at the gemba.
- Ignoring information flow: Emails, approvals, forecasts, and schedules often create major delays.
- Counting inspection as value-added: Inspection verifies quality but does not transform the customer’s product.
- Confusing batch size with demand: Large batches may improve local efficiency while damaging total flow.
- Designing the future state before validating the current state: An inaccurate baseline produces an unreliable target.
- Adding symbols without definitions: Agree on what each symbol means before mapping.
- Failing to assign owners: A future state without accountable implementation is only a diagram.
- Measuring only speed: Track lead time, WIP, yield, throughput, delivery, and customer requirements together.
Build Stronger VSM Capability Through Lean Six Sigma Training
Value Stream Mapping connects Lean flow principles with Six Sigma’s disciplined approach to measurement and analysis. It is especially powerful when integrated with tools such as takt-time analysis, Pareto charts, process capability, root-cause analysis, standard work, and control plans.
If you want to apply VSM confidently across manufacturing, healthcare, logistics, finance, IT, or service operations, structured Lean Six Sigma training can help you develop the method systematically. You can also use the Process Cycle Efficiency Calculator to quantify the relationship between value-added work and total lead time.
Begin your Lean Six Sigma certification journey today and develop the practical capability to map processes, eliminate waste, improve flow, and sustain measurable results. Explore the CSSC-accredited Lean Six Sigma certification courses from White Belt through Master Black Belt.
Kaizen. Kai-Care. Kai-Done. ( Lean Six Sigma)