Emergency department overcrowding is often described as a bed-capacity problem. Yet adding treatment spaces does not automatically improve patient flow. If registration, triage, diagnostics, consultation, admission, or discharge processes remain slow, additional beds can simply create larger queues inside the department.
The more useful question is not, “How many beds do we have?” It is, “How quickly and reliably can patients move through the complete care pathway?”
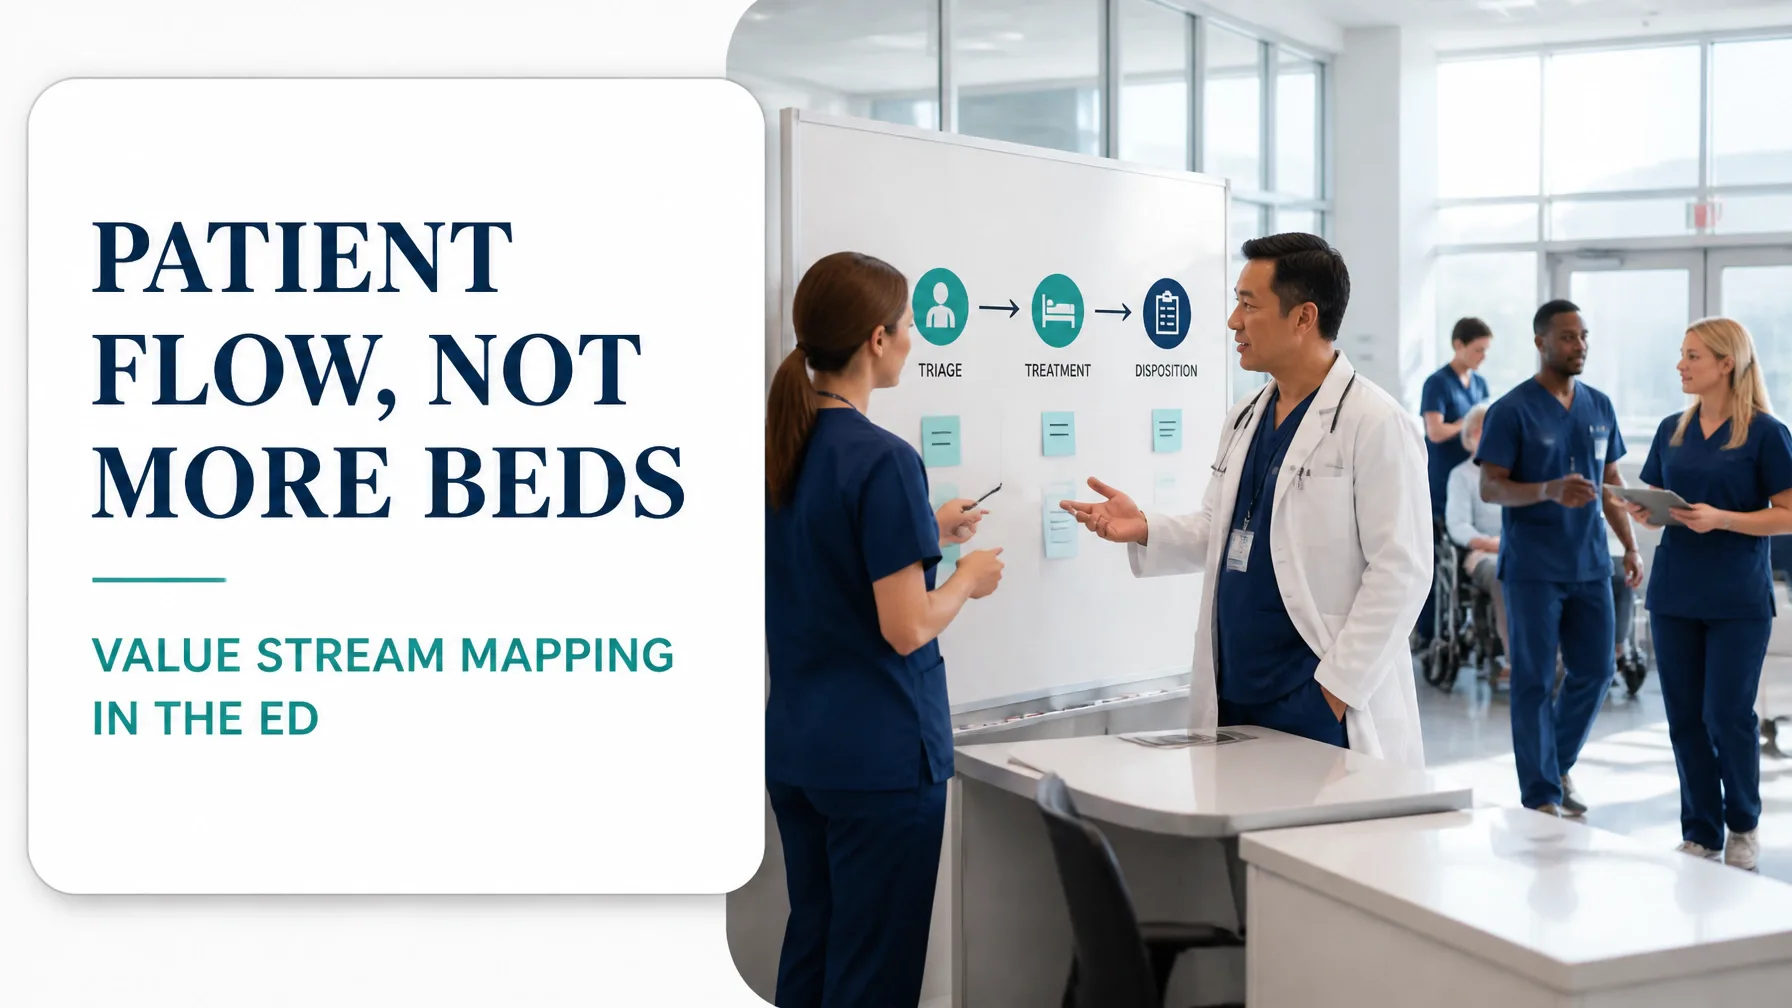
That is where value stream mapping becomes a powerful Lean Six Sigma method. A value stream map makes the entire emergency department journey visible: from arrival and triage to treatment, disposition, discharge, or admission. It separates hands-on care from waiting, rework, handoffs, and information delays, giving clinical and operational teams a shared basis for improvement.
For healthcare leaders, emergency physicians, nurses, and process-improvement professionals, this approach provides a structured way to improve patient flow, reduce emergency department length of stay, lower boarding hours, and address the left-without-being-seen rate.
What Value Stream Mapping Means in an Emergency Department
In the realm of emergency care, the value stream includes every activity required to deliver safe, timely treatment. This includes both patient movement and information movement.
A typical emergency department value stream may include:
- Arrival by ambulance, referral, or self-presentation
- Registration and identification
- Triage and initial assessment
- Waiting for a treatment space
- Clinician assessment
- Laboratory tests, imaging, and treatment
- Specialist consultation or reassessment
- Disposition: discharge, observation, or admission
- Boarding while awaiting an inpatient bed
The fundamental purpose of the map is to compare:
- Process time: direct hands-on work, such as triage assessment or specimen collection
- Waiting time: time spent in queues, awaiting beds, results, transport, or decisions
- Rework: repeated questions, duplicate documentation, corrected orders, or repeated testing
- Flow efficiency: value-added time divided by total elapsed time
The NHS Lean Value Stream Mapping guide and healthcare workflow resources from AHRQ both emphasize mapping the process as it actually operates: not merely how policy documents say it should operate.

How to Map the Current-State ED Patient Journey
1. Define the patient family and scope
An emergency department contains several distinct value streams. A low-acuity patient needing simple treatment does not follow the same pathway as a critically ill patient requiring admission.
Begin with one defined patient family, such as:
- Adult medical patients discharged home
- Low-acuity patients suitable for a fast-track stream
- Patients requiring inpatient admission
- Patients arriving by ambulance
- Patients who leave without being seen
Define the start and end points precisely. For example:
Start: patient arrival timestamp
End: patient leaves the emergency department after discharge or transfer to an inpatient bed
A focused scope prevents the team from creating an attractive but unusable map that attempts to represent every clinical exception.
2. Observe the process at the gemba
The map should be developed where the work occurs. Include triage nurses, registration staff, emergency physicians, technicians, porters, unit clerks, bed managers, inpatient representatives, and patient-flow coordinators.
Collect data across multiple shifts, including weekends and overnight periods. Emergency departments are highly variable systems, so a single observation period may conceal important demand and staffing patterns.
Capture at least:
- Arrival-to-triage wait
- Triage duration
- Triage-to-doctor wait
- Door-to-doctor time
- Time from order to specimen collection
- Laboratory turnaround time
- Imaging turnaround time
- Decision-to-disposition time
- Boarding duration
- Total emergency department length of stay
- Left-without-being-seen percentage
Also record queue sizes, handoffs, interruptions, missing information, and the percentage of work completed accurately the first time.
Worked Example: Making Hidden Delay Visible
Consider a hypothetical 24-hour emergency department with 180 patient arrivals per day. Its current-state data shows the following:
- Average arrival-to-triage wait: 18 minutes
- Average triage-to-doctor wait: 74 minutes
- Average door-to-doctor time: 92 minutes
- Average laboratory turnaround time: 96 minutes
- Average emergency department length of stay: 286 minutes
- Average decision-to-admit-to-departure time: 214 minutes
- Average inpatient boarding time: 7.1 hours
- LWBS rate: 7.8%
- Average direct clinical processing time: approximately 54 minutes
The numbers reveal a critical distinction. Patients spend about 54 minutes receiving direct clinical work, yet remain in the system for 286 minutes. That produces an approximate flow efficiency of:
54 ÷ 286 × 100 = 18.9%
The remaining time is dominated by waiting, movement, queueing, clarification, and handoffs. More beds may help at one point in the pathway, but they will not resolve laboratory delays, slow admission decisions, or inpatient boarding.
| Metric | Current State | Future-State Target |
|---|---|---|
| Arrival-to-triage wait | 18 min | 5 min |
| Triage-to-doctor wait | 74 min | 25 min |
| Door-to-doctor time | 92 min | 30 min |
| Laboratory turnaround | 96 min | 55 min |
| ED length of stay | 286 min | 180 min |
| Decision-to-departure | 214 min | 120 min |
| Boarding time | 7.1 hours | 3.0 hours |
| LWBS rate | 7.8% | Below 3.0% |
| Approximate flow efficiency | 18.9% | Above 30% |
These future-state targets are illustrative rather than universal. Each hospital should set targets using its case mix, acuity, regulatory obligations, staffing model, and baseline performance.
Identifying the Eight Wastes in ED Workflows
The eight DOWNTIME wastes provide a practical diagnostic lens:
- Defects: incorrect patient information, incomplete documentation, mislabeled specimens, or incorrect orders
- Overproduction: duplicate assessments, unnecessary tests, or preparing work before the next step is ready
- Waiting: patients awaiting triage, doctors, test results, transport, consultation, or inpatient beds
- Non-utilized talent: clinical staff spending time searching for equipment or performing avoidable administrative work
- Transportation: patients moved unnecessarily between rooms, diagnostic areas, and holding spaces
- Inventory: excessive work in process, including patients waiting for disposition or untreated charts awaiting review
- Motion: staff walking to locate equipment, paperwork, medications, or available treatment spaces
- Extra-processing: repeated data entry, duplicate questioning, redundant approvals, and manual reconciliation
In an emergency department, waiting and work in process are especially visible. However, they are often symptoms of deeper causes: uneven demand, unclear ownership, poor information flow, variable clinical pathways, and constraints outside the department.
Designing the Future-State Map
A future-state value stream should be designed around patient demand, clinical risk, and downstream capacity. It should not merely move the same queues to another location.
A practical future state may include the following elements.
Stream patients early
Use a structured triage and streaming protocol to direct patients into appropriate pathways:
- Resuscitation and high-acuity care
- Standard emergency treatment
- Fast-track or “see and treat” care
- Minor injuries or ambulatory care
- Direct-to-diagnostic or specialty pathways where clinically appropriate
Streaming should be governed by clear criteria, escalation rules, and regular review. The objective is not to rush assessment; it is to match patient needs with the correct process from the beginning.
Bring clinical decision-making closer to arrival
A provider-in-triage model, senior nurse assessment, or rapid assessment zone can reduce the time between arrival and the first meaningful clinical decision. This is particularly valuable when treatment can begin before a traditional bed becomes available.
The team should monitor safety, reassessment compliance, diagnostic delays, and unplanned returns alongside speed metrics.
Create pull-based bed management
A pull system means the next patient moves when the receiving capacity is ready, rather than pushing additional work into an already congested area.
For bed management, this may involve:
- Real-time visibility of available and soon-to-be-available beds
- Standard admission-ready criteria
- Defined escalation triggers for boarders
- Scheduled transport response times
- Direct communication between the ED, bed management, and inpatient units
- Daily review of patients delayed by non-clinical constraints
The goal is to pull patients toward the next available value-adding step while preventing queues from accumulating unseen.
Reduce diagnostic and information delays
Laboratory and imaging delays should be mapped as part of the patient journey, not treated as separate departmental problems. Teams can examine specimen transport, batching, order clarification, result verification, and notification processes.
A control plan might track:
- Median and 90th-percentile laboratory turnaround
- Percentage of orders requiring clarification
- Time from result availability to clinician review
- Percentage of admitted patients awaiting non-clinical tasks

Running a Kaizen Event with Clinical Staff
A successful ED Kaizen event is short, focused, evidence-based, and clinically led. It should not be a meeting where improvement staff present a predetermined solution.
A practical three-day structure is:
Day 1 : Understand:
Review the project charter, patient-family definition, baseline metrics, direct observations, and current-state map. Validate the map with the staff who perform the work.
Day 2 : Analyze and design:
Use Pareto analysis, cause-and-effect diagrams, time observation sheets, and process data to identify the highest-impact constraints. Design a future-state map and define countermeasures.
Day 3 : Test and control:
Agree on pilot boundaries, responsibilities, measures, escalation rules, and training needs. Begin with a controlled test rather than implementing every change across the department at once.
Clinical staff should help determine whether a proposed change is safe, practical, equitable, and compatible with professional standards. Improvement teams can provide the method, but frontline expertise provides the operational reality.
Integrating Value Stream Mapping with DMAIC
Value stream mapping fits naturally within a broader Lean Six Sigma practitioner framework:
- Define: establish the overcrowding problem, patient family, scope, stakeholders, and critical-to-quality measures
- Measure: collect timestamps, queue sizes, variation data, LWBS rates, and boarding hours
- Analyze: identify bottlenecks, root causes, rework, and relationships between demand and capacity
- Improve: pilot streaming, rapid assessment, pull-based bed management, standard work, and diagnostic-flow changes
- Control: use visual management, control charts, daily huddles, audit measures, and scheduled remapping
The process cycle efficiency calculator can also help teams quantify the proportion of elapsed time that represents direct value-added work.
The Real Fix Is Better Flow
An emergency department may require additional beds, staff, equipment, or inpatient capacity. Value stream mapping does not deny those needs. Instead, it clarifies where capacity is genuinely constrained and where existing capacity is being lost to delay, variation, and poor coordination.
When the complete patient journey is visible, leaders can prioritize improvements that affect the whole system rather than optimizing isolated departments. The result is a more disciplined conversation about patient flow, safety, workforce utilization, and investment.
Build the capability to lead this work. Enrol in Lean Six Sigma training and pursue certification to develop the analytical, process-mapping, and change-leadership skills required to improve healthcare delivery. Explore accredited online pathways from White Belt through Black Belt at Lean 6 Sigma Hub.
Kaizen. Kai-Care. Kai-Done. ( Lean Six Sigma)