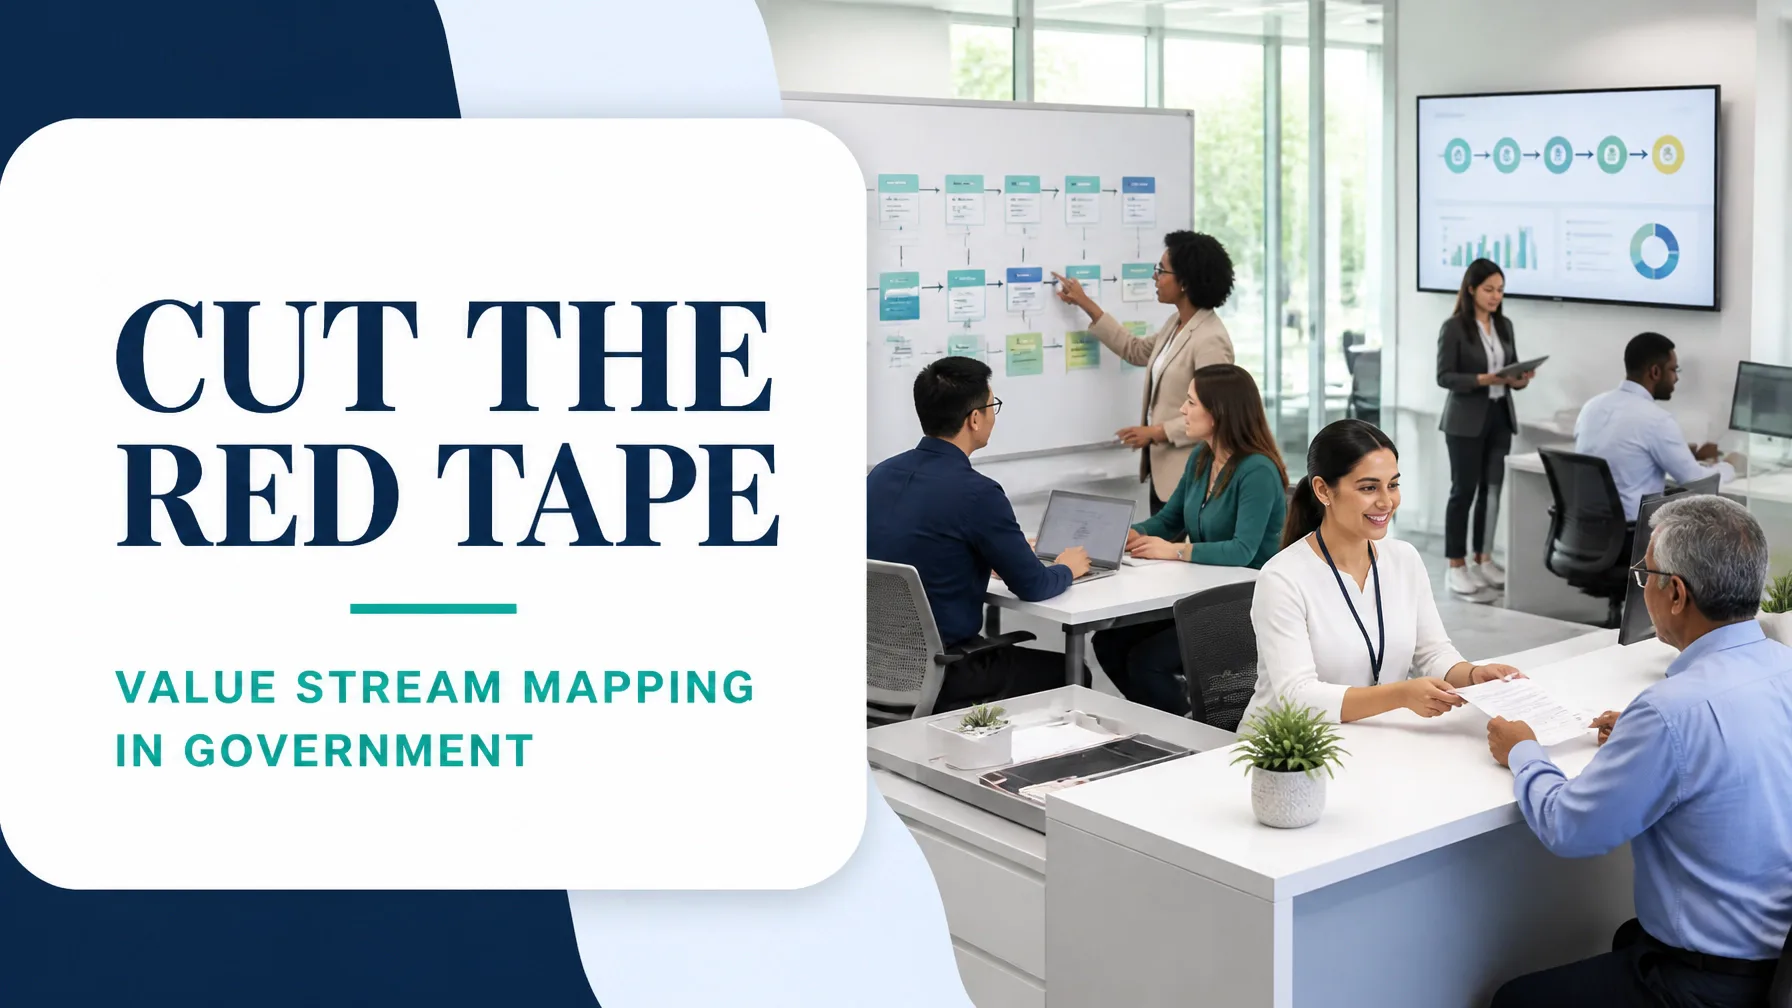
Government services exist to deliver outcomes that matter: a permit issued, a benefit approved, a licence renewed, or a procurement decision completed. Yet the journey from citizen request to final outcome often contains extensive waiting, duplicated data entry, sequential approvals, manual checks, and handoffs between departments.
In the realm of public sector process improvement, the challenge is not usually a lack of commitment. It is the accumulated complexity of regulation, legacy technology, risk controls, organisational boundaries, and historical workarounds. Value stream mapping provides a disciplined way to see that complexity end to end.
Rather than asking whether each department is busy, value stream mapping asks a more important question: How efficiently does the complete service move from intake to outcome?
What Value Stream Mapping Means in Government
A value stream is the full sequence of activities and information flows required to deliver a service to a citizen, business, community group, or internal government stakeholder.
For a government agency, the value stream may include:
- Application submission and identity verification
- Completeness and eligibility checks
- Technical or regulatory review
- External referrals
- Applicant clarification and resubmission
- Financial assessment
- Management approval
- Decision communication and record retention
A value stream map shows both value-adding work and non-value-adding time. It records process time, queue time, work in process, handoffs, rework, approval points, systems used, and information exchanged.
The Lean Six Sigma Hub guide to Value Stream Mapping provides the foundational principles. In government, the same method must be adapted to recognise that compliance activities may be mandatory even when their delivery method is inefficient.
The fundamental purpose is not to remove necessary controls. It is to remove avoidable delay, duplication, ambiguity, and variation while preserving lawful and defensible decision-making.
Why Government Services Carry Approval and Regulatory Waste
Government processes operate within legitimate constraints. Statutory consultation, privacy requirements, financial delegations, records management, procurement rules, and procedural fairness cannot simply be bypassed.
However, a mandated control and a local habit are not the same thing.
For example, legislation may require a decision by an authorised officer, but it may not require:
- Three separate email approvals before the authorised officer reviews the file
- Manual re-entry of citizen information into four systems
- A weekly batch meeting for routine applications
- A paper signature after a secure digital approval
- Rechecking the same evidence at multiple departmental stages
This distinction is central to public sector process improvement. The improvement team should classify every step according to whether it is:
- Legally or regulatorily required
- Required for risk management but capable of redesign
- Locally imposed through policy, convention, or habit
- Not required and suitable for removal
Useful government permitting frameworks distinguish total lead time from active processing time and recommend tracking quality, quantity, complexity, cost, and timeliness. The E-Enterprise Framework of Sample Permitting Metrics is a practical reference for building that measurement structure.

How to Map a Citizen-Facing Service from Intake to Outcome
A strong government value stream map begins with a defined service family. Avoid mapping “all licensing” or “all benefits.” Select one repeatable category, such as standard residential permits or low-risk business licence renewals.
1. Define the citizen outcome
Start at the end of the process and define value from the customer’s perspective. A useful outcome statement might be:
“A complete and accurate permit decision, communicated clearly within 30 calendar days.”
This statement establishes the critical-to-quality requirements:
- Timely decision
- Accurate assessment
- Clear explanation
- Consistent application of rules
- Secure handling of personal information
- Transparent status updates
2. Establish the process boundary
Specify the start and finish points. For example:
- Start: Application and fee received through the online portal
- Finish: Decision issued and case record closed
This prevents the map from becoming a general discussion about organisational performance.
3. Observe the real process
Document what actually happens, not what the procedure manual says should happen. Review a representative sample of cases and collect:
- Calendar lead time
- Active touch time
- Queue time at every stage
- Backlog levels
- Number of handoffs
- Number of approval cycles
- Rework and resubmission rates
- Time spent waiting for applicants or external agencies
- System dwell time
- First-pass completeness rate
A high-level map may contain six to eight major process boxes, with detailed process maps used later for priority areas.
4. Add the information-flow layer
In government, information flow is often more important than physical movement. Map:
- Citizen submissions
- Email requests
- Portal notifications
- Case-management updates
- Spreadsheet trackers
- Document management records
- Specialist referrals
- Approval notifications
- Legacy-system interfaces
Mark whether information is transferred automatically, manually, in batches, or through informal workarounds. Include the time a file spends waiting in an inbox, shared drive, queue, or legacy system.
Worked Example: A Municipal Permit-to-Decision Value Stream
The following is a hypothetical worked example designed to demonstrate the analysis method. It represents a standard permit application processed by a municipal authority.
The agency receives approximately 1,200 applications per month. A review of 200 completed cases shows the following current state:
| Current-state measure | Result |
|---|---|
| Median application-to-decision lead time | 42 calendar days |
| 90th percentile lead time | 78 calendar days |
| Active processing time | 11.5 hours |
| Process cycle efficiency | 1.1% |
| Open backlog | 1,860 applications |
| Average handoffs per application | 17 |
| Average approval cycles | 4.2 |
| First-pass completeness rate | 61% |
| Rework or resubmission rate | 47% |
| Manual data-entry events | 9 per application |
| Legacy-system dwell time | 6.5 days |
| Applications awaiting approval | 310 |
The process contains these major stages:
- Online or email intake
- Administrative completeness check
- Technical review
- Planning and environmental referrals
- Applicant clarification
- Consolidated recommendation
- Supervisor and delegated-officer approval
- Decision issue and records closure
The active review work totals only 11.5 hours, yet the median lead time is 42 days. This gap indicates that the dominant performance problem is not staff effort. It is waiting, rework, batching, and fragmented information flow.
The 6.5-day legacy-system dwell time is especially significant. Applications are received through a modern portal but transferred manually into an older case-management platform. Staff then wait for overnight synchronisation, verify the transfer, and update a separate spreadsheet used for allocation. The system is not merely recording the process; it is shaping the process.
Identifying the Eight Wastes in Administrative Services
The eight Lean wastes, commonly remembered as DOWNTIME, appear in both frontline and administrative government work:
- Defects: Incorrect forms, missing evidence, data-entry errors, or inconsistent decision letters create rework.
- Overproduction: Staff produce duplicate reports, status summaries, or document copies that do not support a required decision.
- Waiting: Applications sit in queues, inboxes, approval folders, or external referral channels.
- Non-utilised talent: Experienced officers spend time searching for information or re-entering data instead of applying technical judgment.
- Transportation: Physical files, printed documents, and digital records move between offices, systems, and email accounts.
- Inventory: Backlogs of incomplete applications, unresolved cases, and unallocated work represent excess work in process.
- Motion: Employees switch between systems, search shared drives, chase signatures, and manually reconcile spreadsheets.
- Extra processing: Duplicate checks, unnecessary approval gates, repeated data requests, and manual validation add effort without increasing citizen value.
This classification should be evidence-based. A step should not be labelled waste simply because it appears inconvenient. The team should ask whether it contributes to a lawful, accurate, timely, and understandable outcome.
Designing the Future State: Triage, Flow and Fewer Gates
A future-state map should preserve essential governance while making routine work flow more directly.
For the hypothetical permit process, the redesigned state includes:
- Digital completeness validation: Mandatory fields, file-type controls, fee validation, and conditional evidence requirements are checked at submission.
- Risk-based triage: Applications are classified as standard, complex, or high-risk using transparent criteria.
- Straight-through processing: Standard, low-risk applications are routed automatically without manual allocation.
- Parallel reviews: Planning, environmental, and technical checks begin concurrently where rules permit.
- Single consolidated recommendation: Specialists contribute to one shared case record rather than creating separate approval chains.
- Delegation-based approval: Routine applications use the lowest authorised approval level; escalation occurs only when thresholds are exceeded.
- Automated notifications: Citizens receive status updates, requests for information, and decision letters through the portal.
- Daily visual management: Supervisors monitor backlog, ageing, queue time, rework, and on-time performance.
The future state is not “automation everywhere.” It is the deliberate matching of controls to risk.

Current-State Versus Future-State Metrics
| Metric | Current state | Future-state target | Expected improvement |
|---|---|---|---|
| Median lead time | 42 days | 18 days | 57% reduction |
| 90th percentile lead time | 78 days | 35 days | 55% reduction |
| Active processing time | 11.5 hours | 8.5 hours | 26% reduction |
| Process cycle efficiency | 1.1% | 2.4% | More than double |
| Open backlog | 1,860 | 900 | 52% reduction |
| Average handoffs | 17 | 8 | 53% reduction |
| Approval cycles | 4.2 | 1.6 | 62% reduction |
| First-pass completeness | 61% | 90% | 29-point increase |
| Rework rate | 47% | 15% | 32-point reduction |
| Legacy-system dwell time | 6.5 days | 1 day | 85% reduction |
| Straight-through processing | 0% | 35% | New capability |
These are targets, not guaranteed outcomes. Each should be validated through a controlled pilot and monitored for unintended effects, including decision quality, equity, accessibility, privacy, and compliance performance.
Sequencing Kaizen Within Compliance Constraints
Government improvement should proceed in a controlled sequence. A practical kaizen roadmap is:
- Baseline the current state: Agree on definitions for lead time, processing time, backlog, rework, and approval cycle.
- Remove obvious duplication: Eliminate repeated data entry and reports that have no decision purpose.
- Improve intake quality: Redesign forms, introduce validation, and publish plain-language evidence requirements.
- Stabilise work allocation: Use visual queues, explicit service rules, and age-based escalation.
- Pilot triage: Test risk categories on a limited service family before expanding.
- Run parallel reviews: Confirm legal and policy permission before changing sequencing.
- Reduce approval gates: Retain only approvals tied to delegated authority, material risk, or statutory obligation.
- Automate proven workflows: Digitise stable processes rather than automating ambiguity.
- Control the gains: Use dashboards, standard work, audit sampling, and regular process reviews.
A compliance register should accompany the improvement plan. For every proposed change, record the relevant legislation, policy owner, risk, control method, approval required, test evidence, and review date.
How Lean Six Sigma Strengthens Public Sector Improvement
Value stream mapping reveals where delay and complexity exist. Lean Six Sigma provides the broader structure for proving why they exist and sustaining the solution.
Within DMAIC:
- Define: Establish the citizen problem, business case, scope, and critical-to-quality requirements.
- Measure: Quantify lead time, touch time, backlog, rework, handoffs, and variation.
- Analyse: Use process data, Pareto analysis, root-cause analysis, and workflow observation.
- Improve: Pilot triage, digital validation, parallel work, and simplified approvals.
- Control: Monitor performance with standard work, dashboards, audits, and ownership controls.
For a complete practical example, explore the Lean Six Sigma hypothetical project. Teams can also use the process cycle efficiency calculator to compare active processing time with total lead time.
The public sector needs professionals who can combine service empathy, governance discipline, process design, and data analysis. That capability is developed through structured lean six sigma training, not through isolated improvement events.
Lean 6 Sigma Hub offers CSSC-accredited Lean Six Sigma certification from White Belt through Master Black Belt, with self-paced online learning, practical simulations, dummy data, templates, charts, and end-to-end DMAIC case studies.
Build the capability to map government value streams, reduce avoidable delay, and lead measurable public sector process improvement by pursuing Lean Six Sigma certification today.
Kaizen. Kai-Care. Kai-Done. ( Lean Six Sigma)