Value Stream Mapping (VSM) is more than a process diagram. It is a structured way to display how materials, information and customer value move through an end-to-end system.
The map becomes especially powerful when every participant interprets its symbols consistently. A warehouse manager, software analyst, finance officer and executive should be able to look at the same map and reach the same conclusion about where work waits, where information is delayed and where improvement effort should begin.
That is the purpose of standard value stream mapping symbols: creating a shared visual language for Lean Six Sigma analysis.
Although organisations may adapt notation to suit manufacturing, healthcare, logistics, finance or IT, the underlying principles remain stable. The following reference explains the core icons, when to use them, and the common errors that reduce their usefulness.

Why Standard VSM Icons Matter
In the realm of process improvement, visual consistency reduces ambiguity. A thick arrow should not mean “information sent by email” on one map and “physical movement” on another.
A well-constructed map helps teams:
- Distinguish value-adding work from waiting and handoffs
- Separate material flow from information flow
- Show inventory, queues and work in process transparently
- Identify where customer demand triggers activity
- Connect operational data to improvement priorities
- Create a common baseline for future-state design
Before mapping, define a small legend. Record what each line, arrow, box and marker means, particularly if the team is combining conventional VSM with service-process or digital-workflow notation.
For additional Lean Six Sigma context, review this Lean Six Sigma practitioner guide.
1. Flow Icons: Defining the Value Stream Boundaries
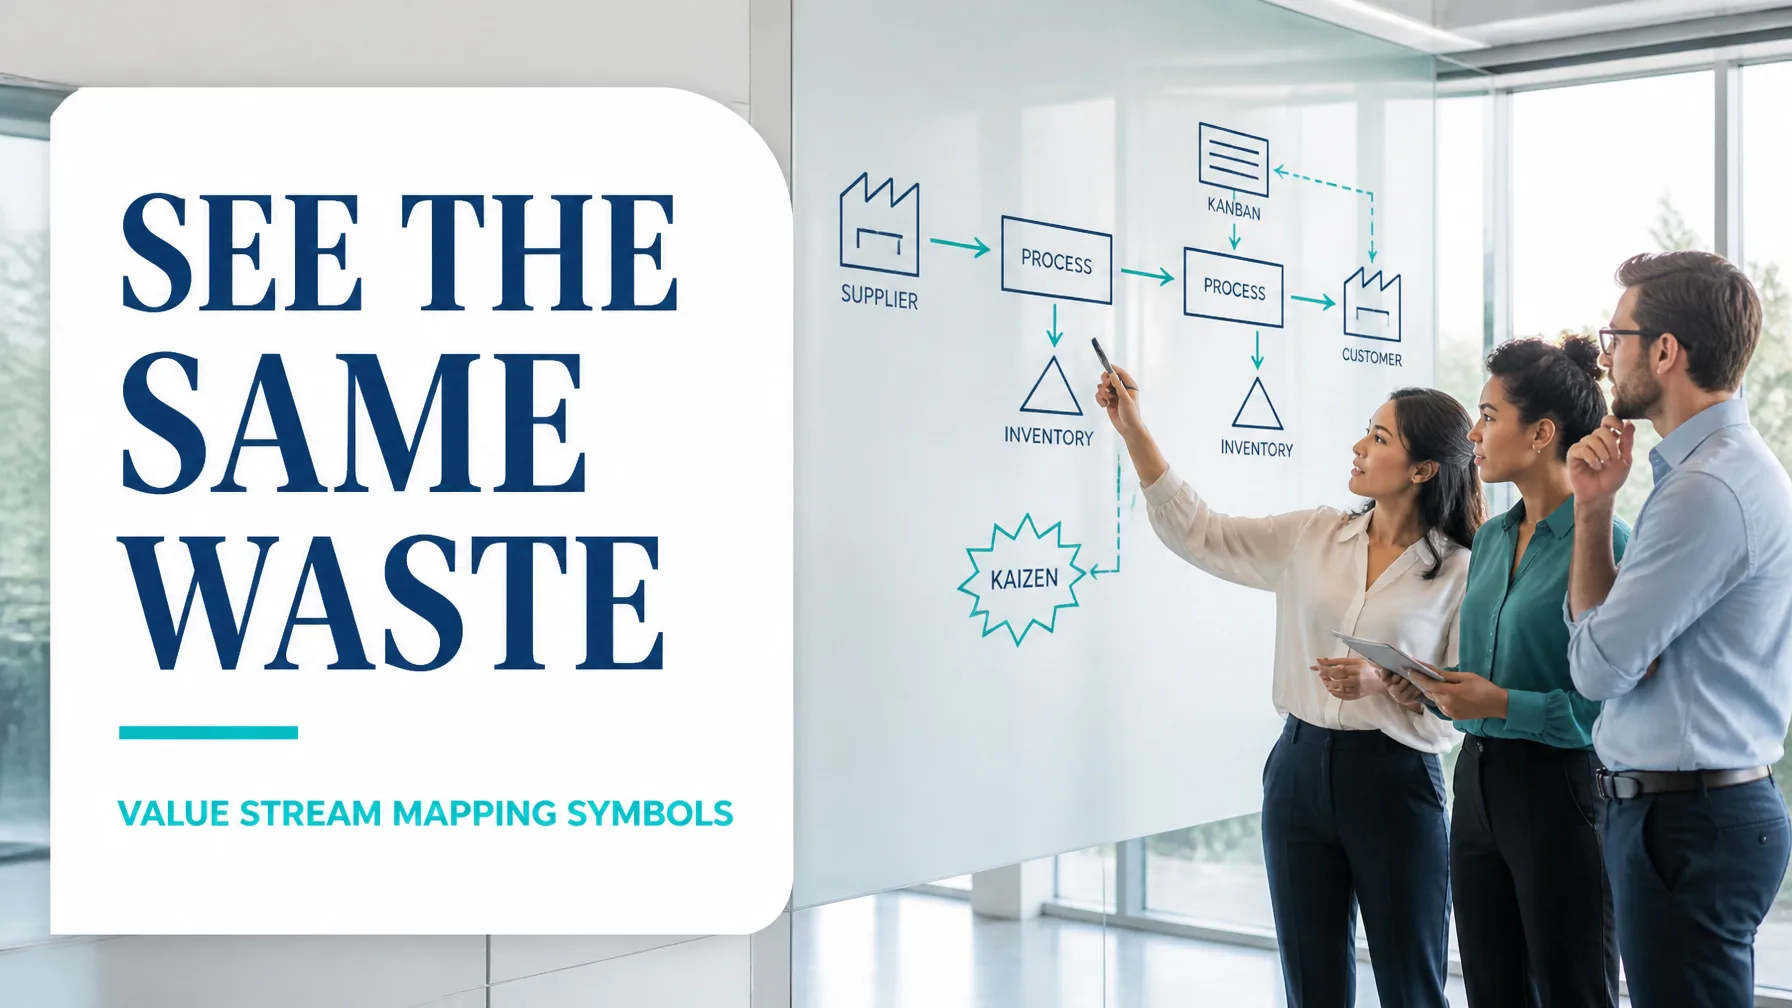
Customer and Supplier
Meaning: External entities at either end of the value stream. The supplier is normally positioned on the left; the customer is positioned on the right.
Use it when: Establishing the boundaries of the process, from incoming materials or information to the completed product or service.
Common mistake: Mapping only internal departments. A VSM should begin with the supplier input and finish with the customer outcome, otherwise important delays and feedback loops may remain outside the analysis.
Process Box
Meaning: A major process step, department, work centre, system or operational activity.
Use it when: Grouping activities that share a similar flow, owner or operating condition. Examples include “Receive Order,” “Credit Assessment,” “Pick and Pack” or “Deploy Release.”
Common mistake: Creating a box for every minor action. Excessive detail can obscure the flow. Begin with major process families, then expand individual steps during later analysis.
Manual Information Flow
Meaning: Instructions, schedules, approvals or updates transmitted manually through paper, spreadsheets, email or direct communication.
Use it when: The information is not automatically transferred between systems.
Common mistake: Treating manual communication as instantaneous. Record the actual delay, frequency and rework associated with the handoff.
Electronic Information Flow
Meaning: Digital information transferred through an ERP, workflow platform, API, EDI connection, shared database or other electronic channel.
Use it when: A system automatically or electronically transmits a demand signal, schedule or transaction.
Common mistake: Assuming electronic means efficient. A digital approval may still spend 18 hours in a queue or require duplicate data entry.
Push Arrow
Meaning: Work or material is sent forward because the upstream process has completed a batch or followed a schedule, rather than because the downstream process is ready.
Use it when: Production, cases, documents or software releases are pushed to the next activity.
Common mistake: Confusing movement with pull. If downstream demand does not trigger the transfer, document it as push flow.
Finished Goods to Customer
Meaning: Completed output delivered to the customer or the next external destination.
Use it when: Showing the final physical shipment, completed service, approved transaction or released digital product.
Common mistake: Ending the map at the final internal process. The customer receipt, fulfilment time and delivery frequency are part of the value stream.
2. Material Icons: Showing Physical Flow and Inventory
Inventory Triangle
Meaning: Inventory or work in process between activities. Label it with the quantity and, where possible, the associated waiting time.
Use it when: Materials, orders, claims, applications or unfinished digital work accumulate between process steps.
Common mistake: Showing inventory without quantity. “Queue” is less useful than “420 applications, equivalent to 3.5 days of demand.”
Safety Stock
Meaning: A deliberate buffer held to protect the process from demand variation, supply disruption or unreliable replenishment.
Use it when: The buffer is intentionally maintained and has a defined target or policy.
Common mistake: Treating all excess inventory as safety stock. Confirm whether the stock is planned protection or unplanned accumulation.
Supermarket
Meaning: A controlled inventory point from which downstream work withdraws what it needs while the upstream process replenishes what has been consumed.
Use it when: Designing or documenting a pull system with defined minimum and maximum levels.
Common mistake: Calling any storage area a supermarket. A true supermarket requires visible control rules, replenishment logic and ownership.
Shipment Truck
Meaning: Physical transportation to or from a supplier, customer, warehouse or external service provider.
Use it when: Showing delivery frequency, route cadence, shipment quantity or transport method.
Common mistake: Omitting transport timing. A daily truck and a weekly truck create very different flow conditions.
FIFO Lane
Meaning: A First-In, First-Out lane that controls the sequence and maximum quantity of work between two processes.
Use it when: Work must be processed in arrival order and a controlled queue is appropriate.
Common mistake: Drawing a FIFO lane without setting a capacity limit. Without a maximum, it becomes an ordinary queue.
3. Pull Icons: Connecting Demand to Replenishment
Pull Arrow
Meaning: Downstream demand authorises upstream movement or replenishment.
Use it when: A process withdraws work, material or information based on actual consumption.
Common mistake: Using a pull arrow simply because the team prefers a pull system. Validate the trigger and show where the demand signal originates.
Withdrawal Kanban
Meaning: A signal authorising the movement of a defined quantity from a supermarket or controlled buffer to the consuming process.
Use it when: Material or work is physically withdrawn according to a card, electronic signal or standard container.
Common mistake: Failing to specify the quantity, destination and replenishment rule.
Kanban Post
Meaning: A visible location where kanban cards or electronic signals are collected, sequenced and acted upon.
Use it when: The map includes a formal control point for production, withdrawal or replenishment signals.
Common mistake: Showing kanban cards without mapping the communication and response process behind them.
4. Information Icons: Making Control Visible
Production Control
Meaning: The planning or control function that receives demand and communicates schedules, priorities or instructions to operating processes.
Use it when: A central team, planning office or system coordinates the value stream.
Common mistake: Treating production control as the source of customer value. It coordinates flow; it does not replace the process that delivers the outcome.
Electronic Data Interchange
Meaning: Structured electronic exchange of transaction data between organisations or systems.
Use it when: Orders, shipping notices, invoices or replenishment instructions move automatically between platforms.
Common mistake: Mapping the technology but not the business rule. Identify what decision the data enables and how quickly the receiving process responds.
Manual Information
Meaning: Paper forms, spreadsheets, printed schedules, email messages or manually updated records.
Use it when: An employee must create, interpret, transmit or re-enter information.
Common mistake: Recording only the transmission time and ignoring preparation, checking and correction time.
Telephone or Verbal Communication
Meaning: Information communicated verbally, whether by telephone, meeting, walk-up discussion or video call.
Use it when: The process relies on informal or direct communication to release work or resolve uncertainty.
Common mistake: Leaving verbal flow undocumented. If a phone call changes priorities, it is a material part of the control system and belongs on the map.
5. Improvement Icons: Directing Action
Kaizen Burst
Meaning: A highlighted improvement opportunity requiring focused investigation or action.
Use it when: The team identifies excessive waiting, rework, unstable flow, unnecessary movement, unclear ownership or another improvement opportunity.
Common mistake: Marking every observation as a kaizen burst. Prioritise opportunities using impact, frequency, effort and alignment with customer requirements.
Operator Icon
Meaning: The number of people required to perform a process step.
Use it when: Labour content, workload balance or staffing flexibility affects capacity.
Common mistake: Counting job titles rather than actual people or labour hours assigned to the process.
Timeline Segments
Meaning: The lower timeline separates processing time from waiting or non-value-adding time.
Use it when: Comparing total lead time with actual value-adding time.
Common mistake: Reporting only cycle time. A process with 26 minutes of work and 4.8 days of elapsed time has a significant flow opportunity.
Data Box
Meaning: A structured summary of the operating conditions for a process step.
Use it when: Quantifying the current state rather than relying on visual impressions.
A useful data box may include:
- Cycle time: 6.5 minutes
- Available time: 450 minutes per shift
- Demand: 72 units per shift
- Takt time: 450 ÷ 72 = 6.25 minutes per unit
- Changeover time: 38 minutes
- Uptime: 91%
- First Pass Yield: 96.2%
- Operators: 2
- Batch size: 120 units
The comparison between 6.5-minute cycle time and 6.25-minute takt time indicates that the process cannot consistently meet demand under its current conditions.
Common mistake: Entering estimates without labelling them. Use observed data, defined sampling periods and clear units.
Opportunity Flag
Meaning: A marker identifying a specific improvement opportunity, decision point or area requiring further validation.
Use it when: The team needs to connect the map to an action plan, analysis task or future-state design decision.
Common mistake: Using flags without owners or next steps. Every priority opportunity should lead to a measurable action.

Worked Mini-Example: Mapping an Order-Fulfilment Process
Consider an online distributor receiving 480 orders per day across two shifts.
The current-state map contains:
- Supplier/customer icons: Packaging supplier on the left and customer on the right.
- Electronic information arrow: Customer orders enter the order-management system.
- Production control box: The fulfilment coordinator releases work in four scheduled waves.
- Process boxes: “Validate Order,” “Pick,” “Pack” and “Ship.”
- Inventory triangles:
- 85 orders awaiting validation
- 140 orders awaiting picking
- 210 packed orders awaiting carrier collection
- Push arrows: Validated orders are released to picking in large batches.
- Kaizen burst: A marker is placed between packing and shipping because completed orders wait an average of 7.2 hours for collection.
- Timeline: Total elapsed time is 31.4 hours, while touch time totals 18.6 minutes.
The future-state concept introduces a supermarket between validation and picking, a withdrawal kanban for replenishment, smaller release quantities and a scheduled carrier window aligned with demand.
After implementation, the target state could reduce:
- Orders awaiting picking from 140 to 60
- Packed-order waiting time from 7.2 hours to 2 hours
- Total lead time from 31.4 hours to 18 hours
- Order First Pass Yield from 94.1% to 98.0%
The symbols do not create the improvement by themselves. They make the relationship between demand, flow, inventory and delay visible enough for the team to design a better system.
How to Build a Clear VSM
Use this practical sequence:
- Select one product or service family.
- Define the start and end points from supplier input to customer outcome.
- Walk the process and collect actual observations.
- Draw major process boxes from left to right.
- Add material flow below and information flow above.
- Record inventory, queues, batch sizes and process data.
- Calculate takt time, lead time, touch time and yield.
- Mark improvement opportunities with kaizen bursts or flags.
- Validate the map with operators, supervisors and process owners.
- Design a measurable future state and action plan.
To deepen the analysis, pair VSM with a Process Cycle Efficiency Calculator and document the improvement story using the Lean Six Sigma Project Storyboard Toolkit.
Turn Visual Language into Improvement Capability
Learning value stream mapping symbols is the foundation. Applying them accurately requires observation, data analysis, stakeholder alignment and disciplined future-state planning.
Whether you are beginning with Lean Six Sigma White Belt training or developing advanced project leadership capability, certification can help you connect VSM with DMAIC, root-cause analysis, process capability and control planning.
Build your Lean Six Sigma capability, pursue professional certification, and learn how to turn value stream mapping into measurable operational results.
Kaizen. Kai-Care. Kai-Done. ( Lean Six Sigma)