Most managers are running their operations on "vibes." They look at a spreadsheet, see that Line A produced 5% more than Line B last week, and immediately declare Line A the winner. They pat themselves on the back for being "data-driven" while completely ignoring the fact that a 5% difference could be nothing more than random noise.
If you are tired of arguing in boardrooms over opinions and "gut feelings," it is time to grow up and use ANOVA (Analysis of Variance).
ANOVA isn’t just a tool for math nerds hiding in a basement; it is the ultimate "BS detector" for process improvement. In the realm of Lean Six Sigma, if you can’t prove your results with statistical significance, you haven’t improved anything: you’ve just gotten lucky. This guide will strip away the academic fluff and show you how to use ANOVA to prove your process actually works.
The Fundamental Problem: The Illusion of Difference
In any process, there is variation. Machines wear down, operators have bad days, and raw materials change. This is what we call "noise." When you compare three different shifts, three different suppliers, or three different machine settings, you will always see different averages.
The question is: Is that difference real, or is it just noise?
If you make a business decision based on random variation, you are wasting money. You might invest $50,000 in "upgrading" to Supplier B because their last shipment was slightly better, only to find out next month that they are actually worse.
ANOVA is designed to solve this. It tells you, with mathematical certainty, whether the differences between your groups are statistically significant or if you’re just chasing ghosts.

What Is ANOVA, Really?
Analysis of Variance (ANOVA) is a statistical method used to compare the means of three or more groups. While a t-test is great for comparing two groups (like "Old Process" vs. "New Process"), it fails when you add a third variable.
To fully appreciate why we don't just run multiple t-tests, you need to understand Alpha Inflation. Every time you run a statistical test, there is a 5% chance (typically) that you will find a difference where none exists: a Type I Error. If you run three separate t-tests to compare three groups, your risk of being wrong jumps from 5% to nearly 14%. Run more tests, and you’re basically guessing.
ANOVA solves this by looking at the data all at once. It asks: Is the variation between the groups significantly larger than the variation within the groups?
The Signal-to-Noise Ratio (The F-Statistic)
The "magic number" in ANOVA is the F-value. You can think of the F-value as a ratio of Signal to Noise.
- Signal (Between-Group Variance): How much do the averages of the groups differ from each other?
- Noise (Within-Group Variance): How much do the individual data points inside each group spread out?
If your signal is high and your noise is low, your F-value will be large. A large F-value leads to a low p-value (typically less than 0.05). When that p-value drops below your threshold, you can finally stop guessing. You have proof.
For a deeper dive into these terms, check out our Lean Six Sigma concepts and glossary.
The RDMAICS Context: Where ANOVA Fits
In the Lean Six Sigma framework, ANOVA is a heavyweight champion of the Analyze Phase. You have already mapped your process, measured your data, and now you need to identify the root causes of variation.
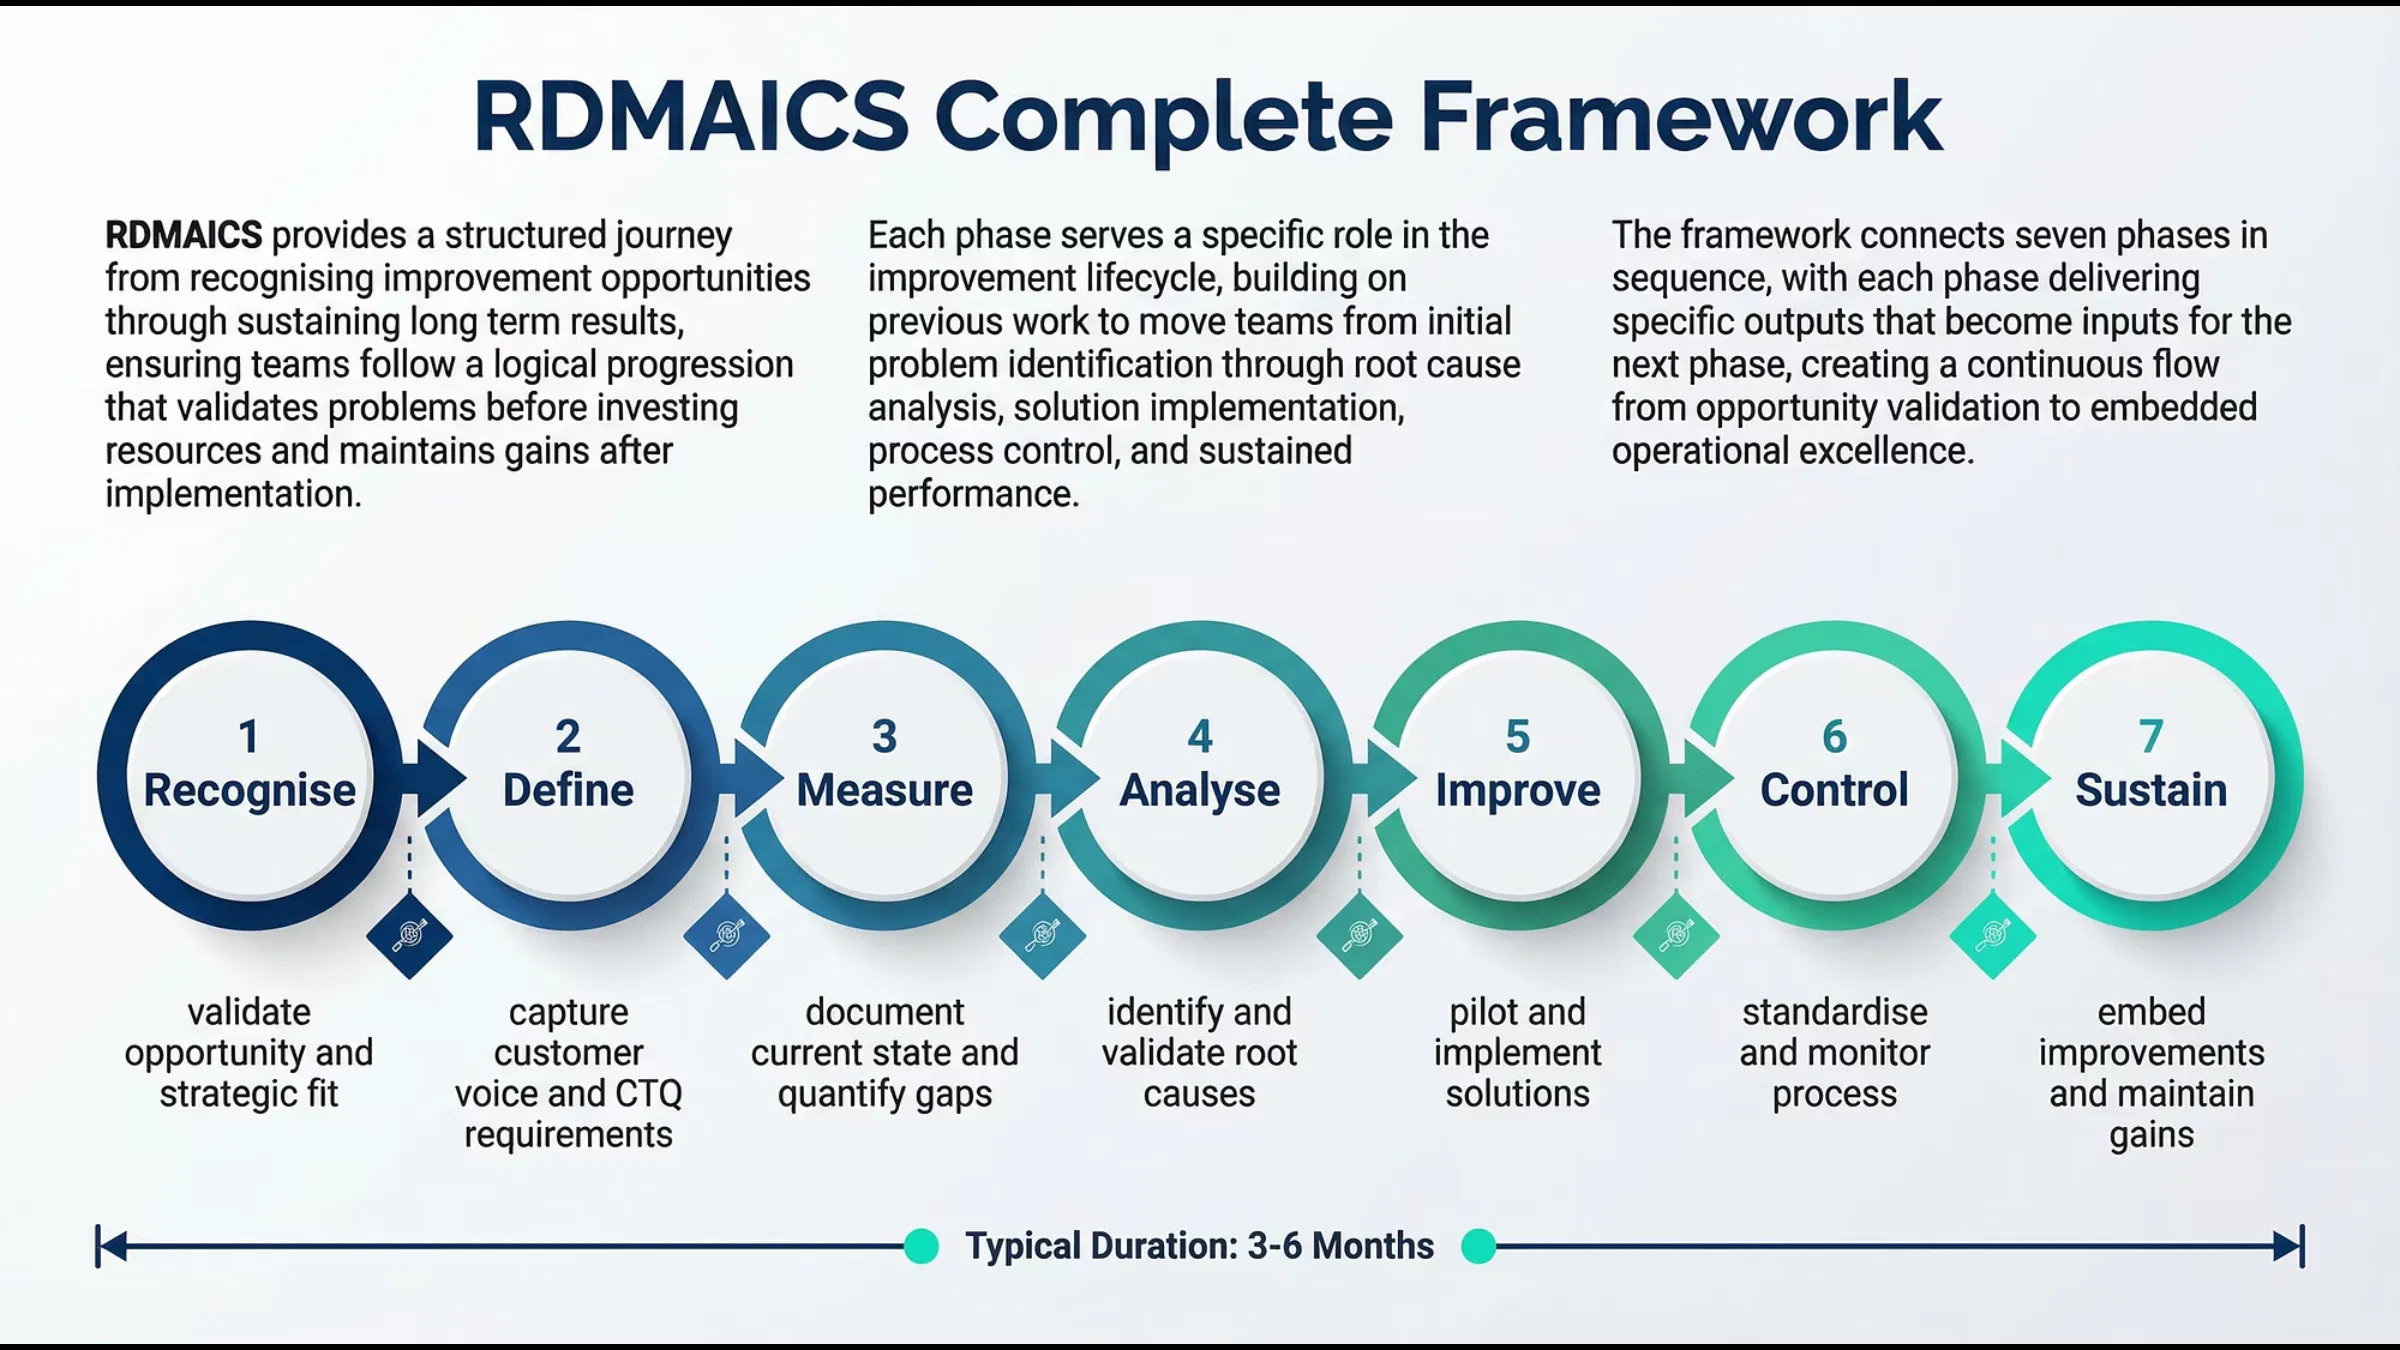
As shown in the RDMAICS framework above, the Analyze phase is where you separate the "Vital Few" variables from the "Trivial Many." You use ANOVA to test your hypotheses about which factors actually impact your output. For instance, does the temperature of the oven actually change the strength of the part, or are you just imagining it?
Don’t Be Lazy: The Assumptions You Must Meet
You cannot just throw garbage data into a statistical software package and expect the truth. ANOVA is a parametric test, which means it has "rules." If you break these rules, your results are a lie.
- Independence: Each data point must be independent. You can't measure the same person three times and call it three different groups.
- Normality: The data in each group should be approximately normally distributed. If your data is skewed, your ANOVA is worthless. You should always perform the Shapiro-Wilk test to verify normality before proceeding.
- Homogeneity of Variance: The "spread" (variance) of your groups should be roughly equal. If Group A is tightly packed and Group B is all over the map, the math breaks down.
If your data doesn't meet these criteria, you aren't doing Six Sigma: you're doing creative writing with numbers.

A Real-World Example: Proving a Training Program Works
Let's look at a hypothetical case. A call center manager wants to know if three different training modules (A, B, and C) result in different average handling times (AHT).
- Group A (Standard Training): Mean AHT of 450 seconds.
- Group B (AI-Assisted Training): Mean AHT of 435 seconds.
- Group C (Peer-to-Peer Mentoring): Mean AHT of 442 seconds.
At first glance, Group B looks like the winner. Most managers would roll out the AI-assisted training immediately. But a Lean Six Sigma Black Belt knows better. They run an ANOVA.
The ANOVA results show:
- F-Value: 1.25
- P-Value: 0.32
Because the p-value is 0.32 (well above 0.05), the difference is not statistically significant. This means the variation we see is just "noise." The AI training isn't actually better; the group just happened to have a few faster calls by chance. By running this test, the company saves thousands of dollars by not implementing a training program that doesn't actually work.
This is the power of moving from the Measure phase to the Analyze phase correctly. If you need help structuring these types of projects, look at a LSS Black Belt sample project to see how data drives decisions.
Identifying Noise Factors
To get the most out of ANOVA, you must also account for things you aren't intentionally testing. These are called "noise factors." If you don't control for them, they will inflate your within-group variance and hide your "Signal."
To master this, you need to learn how to identify and control noise factors. High-performing processes aren't built on luck; they are built by aggressively eliminating the variables that cause unpredicted swings in data.
What Happens After the ANOVA? (Post-Hoc Tests)
If your ANOVA returns a p-value of 0.01, congratulations: you have proven that at least one group is different from the others. But ANOVA doesn't tell you which one.
To find the specific "winner," you must run a Post-Hoc Test (like Tukey’s HSD). This is the final step in proving your process works. It allows you to say, "Not only is there a difference, but Group B specifically outperforms Group A and Group C."
This level of precision is exactly what leadership expects from a certified professional. It moves the conversation from "I think" to "The data proves."
Stop Being an Amateur
If you are still making decisions based on simple averages, you are leaving your career and your company’s success to chance. ANOVA is the threshold between being a "manager who uses data" and being a Lean Six Sigma expert who solves problems.
In a world where AI is doing the heavy lifting of data collection, your value lies in your ability to interpret that data and make the right call. Understanding advanced statistics is why Lean Six Sigma certification will change the way you use AI at work. It gives you the framework to tell the machine what to look for and the wisdom to know when the results matter.

The time for guessing is over. If you want to lead high-impact projects and command the salary of a top-tier professional, you need to master the tools of the trade. Stop hiding behind simple spreadsheets and start leading with statistical authority.
Enroll in our Green Belt or Black Belt certification programs today and start proving your worth with facts, not opinions.