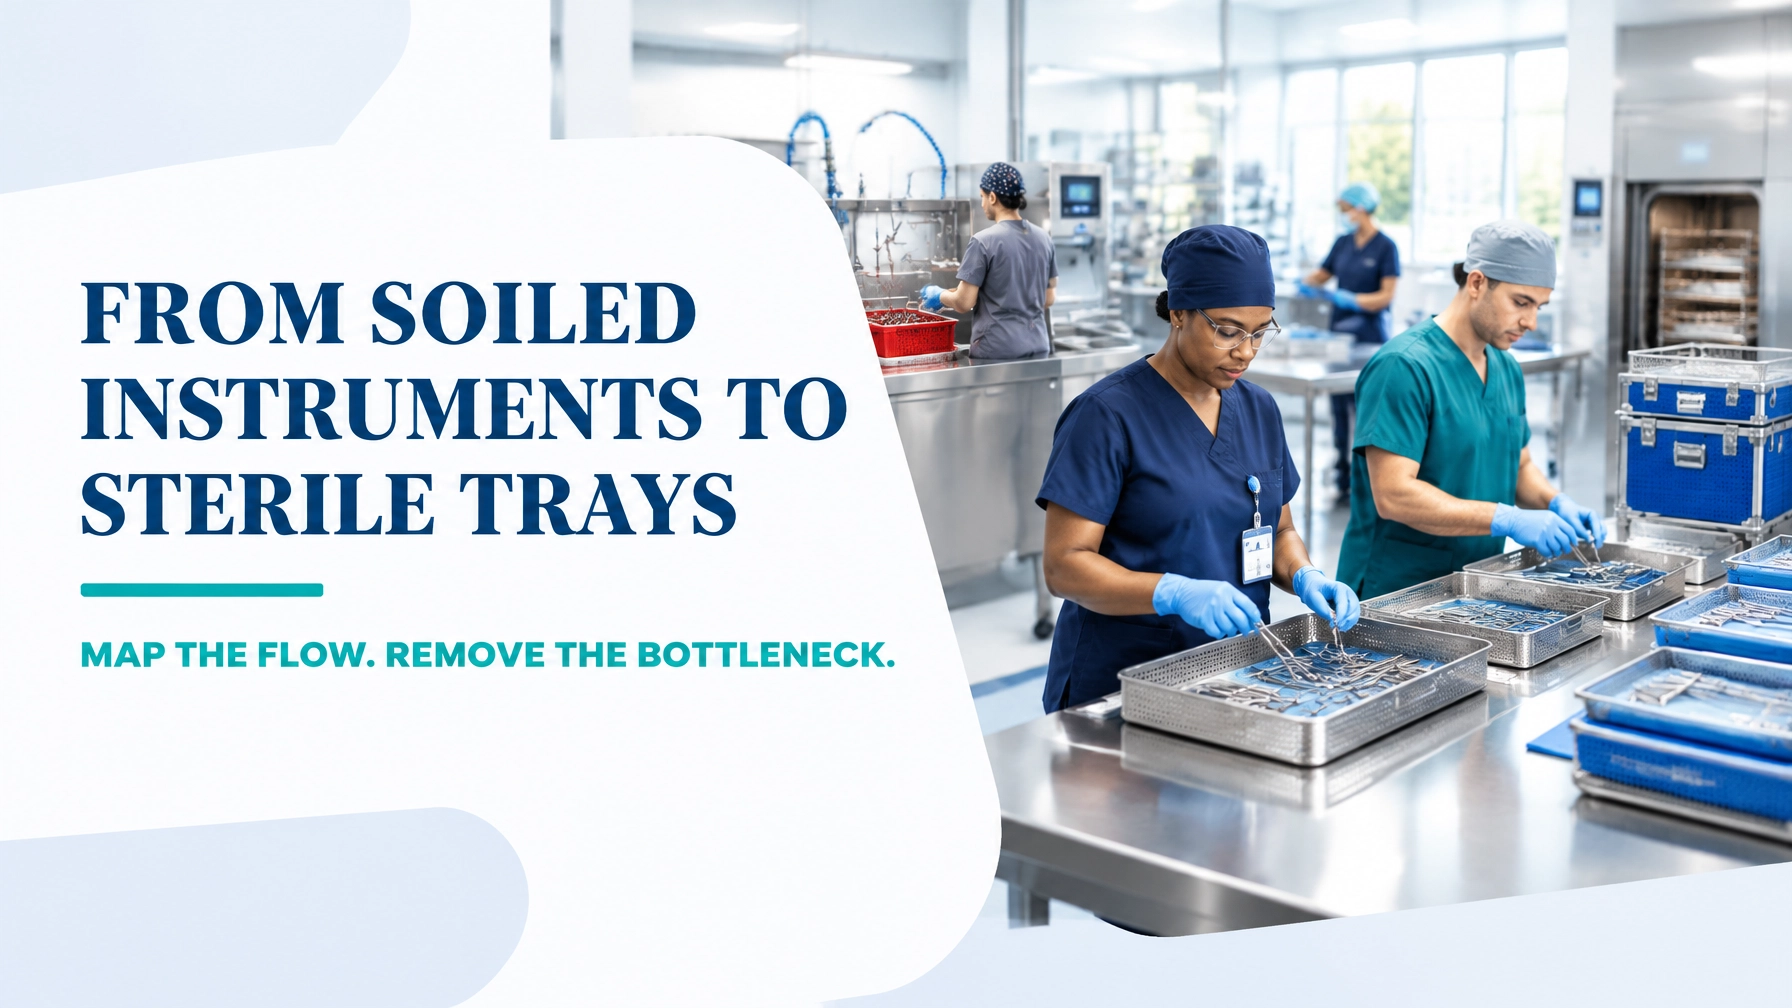
In a hospital sterile processing department (SPD), turnaround time is more than an operational metric. It directly influences operating-room readiness, surgical scheduling, tray availability, staff workload, and patient flow.
Value Stream Mapping (VSM) provides a structured way to see the complete journey of reusable instruments: from point-of-use collection through decontamination, washing, inspection, assembly, sterilization, storage, and case cart delivery. Instead of optimizing one workstation in isolation, the team examines the entire material and information flow.
The fundamental purpose is to identify where time accumulates, where work-in-process expands, and where the department loses its ability to meet surgical demand. The Lean Enterprise Institute definition of Value Stream Mapping provides the broader Lean foundation: map every step required to deliver value and distinguish value-creating work from delay and waste.
This guide uses an illustrative SPD example to show how a current-state map can become a practical future-state improvement plan.
1. Select a Focused SPD Value Stream
A complete hospital SPD may process thousands of instruments and hundreds of tray types. Mapping everything at once creates an unwieldy project. Start with a product family that has a measurable service problem.
For this example, the scope is:
- Product family: Reusable general surgery and orthopaedic instrument trays
- Start point: Instruments leave the operating room after use
- End point: Sterile tray is delivered to the correct case cart
- Demand: 60 trays required during the primary 10-hour operating schedule
- Customer: Operating room, surgical teams, patients, and hospital leadership
- Problem statement: Tray shortages and late case carts are creating daily turnaround pressure
Include both physical and information flow:
- OR schedule and add-on case information
- Used-instrument transport
- Decontamination and washing
- Inspection and functional testing
- Assembly and packaging
- Sterilization, cooling, and release
- Sterile storage and case cart delivery
The AHRQ Value Stream Mapping resources reinforce the importance of observing the real workflow rather than relying solely on policy documents or assumed process times.

2. Build the Current-State Map
A current-state map should reflect what actually happens across several representative days, including peak demand, add-on cases, equipment interruptions, and staffing variation.
Collect the following at each process box:
- Cycle time and batch size
- Queue or waiting time
- Number of trays in process
- Staffing and equipment availability
- First Pass Yield (FPY)
- Rework and missing-instrument defects
- Sterilizer or washer downtime
- Priority changes and information handoffs
Worked SPD Example
The department has 510 minutes of effective work time during the primary schedule after breaks, huddles, and planned non-processing activities.
With demand for 60 trays:
Takt time = Available work time ÷ Customer demand
510 minutes ÷ 60 trays = 8.5 minutes per tray
Takt time does not mean every instrument tray completes the entire journey in 8.5 minutes. It establishes the required output rhythm. Each process must have sufficient capacity, and queues must be controlled so that trays are ready when the OR needs them.
The observed median turnaround from OR return to case cart delivery is 12.8 hours, with a 90th-percentile turnaround of 21.2 hours. The department reports:
- 9 tray shortages per day
- 7 late case carts per 60 scheduled trays
- 93% First Pass Yield
- 159 tray equivalents of total WIP and inventory
- 11.7% late-cart rate
- 101.5 minutes of cumulative touch and allocated processing time per tray
The activity ratio is:
Activity ratio = Touch time ÷ Total elapsed lead time
101.5 minutes ÷ 768 minutes = 13.2%
Only 13.2% of elapsed time is active processing or handling. The remaining time is primarily waiting, queueing, batch delay, storage, transport, or information delay. Under a strict Lean definition, some inspection, sterilization, and quality-control activities may be necessary rather than directly value-added. That distinction should be discussed with clinical and infection-prevention stakeholders rather than decided by a process team alone.
Current-State Data
| Process step | Cycle or allocated time | Average waiting time | WIP or queue | Observed issue |
|---|---|---|---|---|
| OR pickup and transport | 12 min | 24 min | 14 trays | Irregular collection rounds |
| Decontamination | 18 min | 42 min | 22 trays | Dirty holding congestion |
| Washer processing | 9 min allocated | 58 min | 18 trays | Batch loading and washer queue |
| Inspection | 7 min | 76 min | 31 trays | Staffing imbalance at peak |
| Assembly and packaging | 14 min | 119 min | 44 trays | Largest queue and rework loop |
| Sterilization and release | 23.5 min allocated | 91 min | 26 trays | Batch timing and release delays |
| Sterile storage and picking | 6 min | 68 min | 18 trays | Poor priority visibility |
| Case cart assembly and delivery | 8 min | 30 min | 6 carts | Missing-tray escalation |
The largest constraint is not necessarily the longest processing step. Assembly has the highest queue and is closely connected to the department’s 93% FPY. When a tray is missing an instrument or requires correction, it re-enters the flow and competes with new work.
3. Identify the Eight DOWNTIME Wastes
The current-state map makes the eight wastes visible in the specific SPD context.
- Defects: Missing instruments, incorrect assembly, damaged items, wet packs, documentation errors, or failed indicators requiring reprocessing.
- Overproduction: Processing low-priority trays ahead of imminent surgical demand while urgent trays remain unavailable.
- Waiting: Trays waiting for decontamination, washers, inspectors, assemblers, sterilizer capacity, release, or transport.
- Non-utilized talent: Certified technicians spending excessive time searching, chasing status updates, or performing avoidable rework.
- Transportation: Unnecessary movement between decontamination, assembly, sterilization, storage, and case cart areas.
- Inventory: Excess dirty, partially processed, or sterile trays that conceal flow problems and consume space.
- Motion: Reaching, walking, searching for instruments, or repeatedly checking paper and electronic lists.
- Extra-processing: Duplicate counts, repeated status calls, redundant documentation, and inspection activities not aligned to risk or standard work.
The map should also distinguish variation from chronic process weakness. A temporary sterilizer outage is different from a predictable daily assembly queue. The corrective response will not be the same.
4. Use Demand, Voice and Process Data Together
An SPD improvement team should balance three perspectives:
- Voice of the Customer: OR teams require complete, sterile trays at the agreed time.
- Voice of the Business: The hospital needs safe throughput, controlled cost, regulatory compliance, and reliable surgical capacity.
- Voice of the Process: Actual queue times, cycle times, FPY, tray shortages, and equipment uptime show what the system can currently deliver.
A time observation sheet can separate hands-on work from waiting and searching. A simple status board can show whether each tray is dirty, in decontamination, under inspection, in assembly, sterilized, released, or staged for delivery.

5. Design the Future-State Map
The future state should not simply demand that staff work faster. It should redesign flow, priority rules, capacity, and feedback loops.
Recommended future-state principles include:
- Create fixed OR-to-SPD collection intervals with an escalation path for urgent returns.
- Use a visual pull signal linked to the next case-cart requirement.
- Establish a controlled FIFO lane for standard work and a clearly governed priority lane for urgent clinical needs.
- Level washer and sterilizer loading rather than waiting for maximum batch size.
- Align assembly staffing with the hourly demand profile.
- Introduce standard assembly checklists and first-time quality checks.
- Define minimum and maximum quantities for high-turnover tray families.
- Review shortages at the daily tier meeting using actual data.
Current State Versus Future State
| Metric | Current state | Future-state target | Improvement |
|---|---|---|---|
| Median instrument-set turnaround | 12.8 hours | 6.1 hours | 52.3% reduction |
| 90th-percentile turnaround | 21.2 hours | 10.0 hours | 52.8% reduction |
| Cumulative touch/allocated time | 101.5 min | 88 min | 13.3% reduction |
| Activity ratio | 13.2% | 24.0% | 10.8 percentage points |
| Total WIP and inventory | 159 trays | 72 trays | 54.7% reduction |
| Assembly queue | 44 trays | 18 trays | 59.1% reduction |
| First Pass Yield | 93% | 98% | +5 percentage points |
| Tray shortages per day | 9 | 2 | 77.8% reduction |
| Late case carts | 7 of 60 | 2 of 60 | 71.4% reduction |
| Late-cart rate | 11.7% | 3.3% | 8.4 percentage-point reduction |
These are improvement targets, not guarantees. Each target should be validated through a pilot, capacity check, and clinical governance review. Sterilization parameters, release requirements, and infection-prevention controls must never be bypassed to achieve a faster metric.
6. Sequence Kaizen Events in Priority Order
A practical kaizen sequence prevents the team from making disconnected changes.
1. Assembly Flow and First-Time Quality
Priority: Highest. Reduce the 44-tray queue, standardize workstation layout, confirm instrument counts, and analyze the most frequent rework causes.
2. Demand Visibility and Case-Cart Pull
Create a shared schedule showing the next required trays, due times, priority status, and current location. This reduces phone calls, searching, and competing priorities.
3. Decontamination and Transport Rhythm
Standardize collection rounds, dirty holding limits, cart identification, and handoff responsibilities. Measure elapsed time from OR exit to decontamination start.
4. Washer and Sterilizer Load Planning
Use demand data to schedule smaller, appropriate loads and reduce avoidable batch waiting. Track equipment uptime, cycle release time, and load-to-need alignment.
5. WIP and Inventory Control
Set visual limits for dirty, in-process, and sterile tray inventory. A lower WIP level is valuable only when it is supported by stable flow and reliable replenishment.
6. Daily Control and Sustainment
Review takt attainment, FPY, shortage count, late carts, turnaround time, and open defects at a daily tier meeting. Update the value stream map after the pilot to create the next future-state cycle.

From Map to Measurable Capacity
Value Stream Mapping turns a broad complaint: “trays are always late”: into a measurable system of queues, cycle times, demand signals, WIP, variation, and defects.
When the SPD team connects takt time to actual capacity, maps every waiting point, and sequences kaizen around the constraint, it can improve turnaround without compromising safety. The result is not merely a cleaner process. It is greater confidence that the right sterile tray will be available for the right case at the right time.
For additional Lean Six Sigma application tools, explore the Process Cycle Efficiency Calculator, the Time and Motion Study guide, and the Kaizen implementation guide.
Build the capability to map complex healthcare processes, quantify waste, and lead sustainable improvement by pursuing Lean Six Sigma certification with Lean 6 Sigma Hub. Explore the self-paced, CSSC-accredited pathway from White Belt through Black Belt and develop the practical skills to improve flow in your own organisation.
Kaizen. Kai-Care. Kai-Done. ( Lean Six Sigma)