Steel manufacturing is a capital-intensive process industry. Furnaces, casters, rolling mills, finishing lines and material-handling systems represent substantial fixed investment, while energy, alloys, labour and maintenance add significant operating cost. In this environment, improving isolated machine efficiency is not enough. The commercial result depends on how smoothly the entire value stream converts a customer order into an acceptable, on-time shipment.
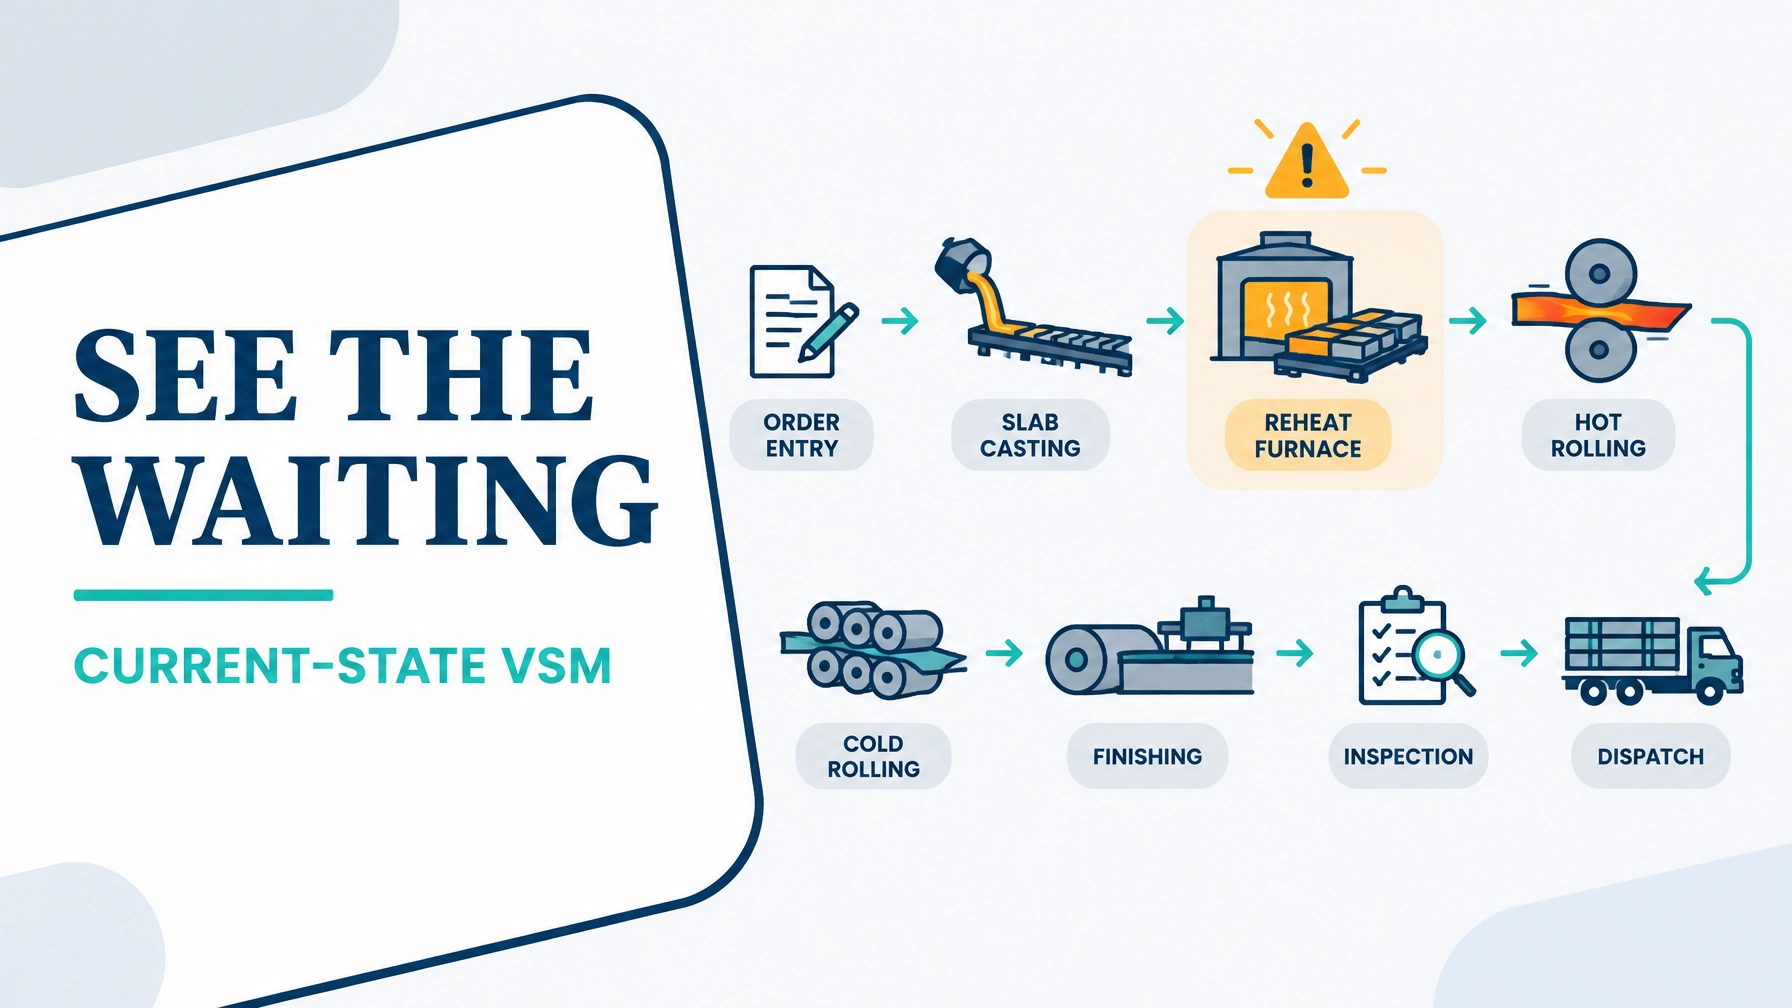
Value Stream Mapping (VSM) makes that end-to-end performance visible. It connects the flow of information and material from order entry through slab casting, reheating, hot rolling, cold rolling, finishing, inspection and dispatch. More importantly, it exposes where capital is trapped in work in process, where customer orders wait, and where a constraint limits total throughput.
This guide presents an illustrative steel mill case with 22,000 tonnes of monthly demand, a 34-day average order-to-ship lead time, and a reheat furnace operating at 87% utilisation. The figures are worked examples for improvement planning; each mill should validate its own baseline through a Gemba walk and verified production data.
1. Define the Steel Value Stream Before Drawing the Map
A steel mill may contain several product families with different routes. Mapping the entire site at once usually creates an overly complex diagram. Begin with a high-volume family of customer coil orders that follows a consistent route:
Customer order entry → slab casting → reheat furnace → hot rolling → cold rolling → finishing and processing → inspection → dispatch
The scope should include both material flow and information flow:
- Customer orders, forecasts and specifications
- Production planning and campaign schedules
- Furnace and rolling-mill sequencing
- Quality release decisions
- Inventory movement and dispatch instructions
The Voice of the Customer should be translated into measurable CTQs, such as:
- Order-to-ship lead time: target below 20 days
- On-time delivery: at least 95%
- First-pass yield: at least 96%
- Surface, gauge and dimensional compliance
- Correct grade, width, thickness and coil quantity
- Reliable shipment documentation
The Voice of the Business must also be represented. The mill needs strong asset utilisation, controlled energy consumption, stable throughput and acceptable working capital. A future-state design must balance these priorities with customer expectations rather than maximising one metric in isolation.
2. Current-State Map: Where the 34 Days Go
The current-state map should be constructed from observation, production records, ERP transactions, inventory counts and interviews with operators, planners and quality staff. A practical data box for each process includes:
- Cycle or processing time
- Changeover time
- Availability and utilisation
- First-pass yield
- Batch or campaign size
- WIP before and after the process
- Daily demand and available production time
The representative current-state baseline is:
- Monthly demand: 22,000 tonnes
- Average daily demand: approximately 733 tonnes
- Average order-to-ship lead time: 34 days
- Value-added processing time: 4.2 days
- Waiting and queue time: 29.8 days
- Reheat furnace utilisation: 87%
- First-pass yield: 91%
- On-time delivery: 82%
- Observed WIP across the route: approximately 17,100 tonnes
| Process stage | Waiting or queue time | Value-added processing time | Representative WIP |
|---|---|---|---|
| Order entry and production planning | 3.5 days | 0.2 days | 3,500 t |
| Slab casting | 4.5 days | 0.7 days | 2,800 t |
| Reheat furnace | 7.0 days | 0.5 days | 4,100 t |
| Hot rolling | 4.8 days | 0.6 days | 3,200 t |
| Cold rolling | 3.8 days | 0.8 days | 1,600 t |
| Finishing and processing | 3.2 days | 0.7 days | 900 t |
| Inspection and release | 2.5 days | 0.4 days | 400 t |
| Dispatch staging | 0.5 days | 0.3 days | 600 t |
| Total | 29.8 days | 4.2 days | 17,100 t |
The map indicates that the furnace is not merely a hot piece of equipment; it is the system’s pacing constraint. At 87% utilisation, it has limited recovery capacity for breakdowns, grade transitions and demand variation. Slabs accumulate before reheating, while the hot mill can experience starvation when the required grade, width or temperature condition is unavailable.
A simplified information flow may look like this:
Customer forecast and order → central planning → monthly production plan → weekly campaign schedule → daily furnace and mill instructions → inspection release → dispatch schedule
When every process receives an independent schedule, the system behaves as a push environment. Casting produces to its schedule, reheating produces to its schedule, and rolling produces to its schedule: even when downstream capacity or customer priority has changed.

3. The Eight Wastes in the Current Steel Flow
The current-state map makes the eight DOWNTIME wastes tangible:
- Defects: Slab chemistry variation, surface defects, gauge deviations and inspection failures create rework, downgrade or scrap.
- Overproduction: Large campaigns produce tonnage before confirmed demand or downstream capacity is ready.
- Waiting: Slabs wait for furnace entry; hot-rolled coils wait for cold rolling; finished coils wait for inspection or transport.
- Non-utilised talent: Operators spend time expediting orders, searching for material status or correcting schedule discrepancies rather than improving the process.
- Transportation: Coils and slabs move between storage zones because campaign priorities change after material has already been staged.
- Inventory: WIP between casting, reheating, rolling and finishing ties up working capital and conceals flow problems.
- Motion: Planners, quality staff and material handlers repeatedly search systems, paperwork and storage locations for the latest order status.
- Extra-processing: Duplicate inspections, repeated data entry and additional handling occur when specifications or release rules are unclear.
The Lean Six Sigma Hub process bottleneck analysis guide provides a useful framework for confirming whether the apparent constraint is caused by capacity, changeover loss, downtime, quality loss or scheduling variation.
4. Design the Future State Around the Constraint
The future state should not attempt to make every process run at maximum utilisation. The fundamental purpose is to create a controlled flow that meets customer demand with less waiting, less WIP and fewer quality interruptions.
Campaign scheduling around furnace capacity
Group orders using a deliberate sequence based on:
- Steel grade and chemistry
- Slab width and thickness
- Hot-rolling temperature requirements
- Cold-rolling route
- Customer due date
- Changeover and cleaning requirements
The objective is not simply to create larger campaigns. It is to sequence campaigns so that the furnace is protected from avoidable transitions while downstream orders remain responsive.
SMED-style changeover reduction
Apply Single-Minute Exchange of Die (SMED) principles to roll, guide, tooling, width and product-style changeovers:
- Separate internal activities, which require the line to stop, from external preparation.
- Prepare rolls, guides, tools and documents before the current campaign ends.
- Use standard settings, quick clamps and pre-positioned equipment.
- Confirm the next order and material before shutdown.
- Measure every changeover with a time observation sheet.
For example, reducing an average hot-mill style changeover from 75 minutes to 30 minutes across 18 monthly transitions recovers 13.5 hours per month. At a constraint rate of 55 tonnes per hour, that represents approximately 743 tonnes of potential capacity.
Flow-based WIP caps
Replace uncontrolled accumulation with explicit WIP limits:
- Maximum slabs awaiting reheating: 2,200 tonnes
- Maximum hot-rolled coils awaiting cold rolling: 1,800 tonnes
- Maximum coils awaiting finishing: 900 tonnes
- Finished-goods dispatch supermarket: 600 tonnes
When a cap is reached, upstream production does not automatically continue. The team investigates the reason for blocked flow. This is a practical pull discipline that prevents the furnace and rolling mills from becoming storage mechanisms.
Furnace sequencing and pacemaker control
The reheat furnace should become the protected pacemaker for the upstream-to-hot-rolling segment. A daily sequence should consider:
- Furnace loading pattern
- Grade and width transitions
- Required rolling temperature
- Hot-mill availability
- Downstream customer priority
- Planned maintenance windows
Visual controls, Andon escalation and a defined reaction plan should identify furnace temperature deviations, slab delays, unplanned stops and quality risks in real time.

5. Current State Versus Future State
The following targets represent a realistic improvement horizon after stabilisation and several focused kaizen events. They are not a substitute for a validated capacity model.
| Metric | Current state | Future-state target | Improvement |
|---|---|---|---|
| Monthly shipped tonnage | 22,000 t | 22,000–24,000 t | Demand met with recovery capacity |
| Order-to-ship lead time | 34 days | 18 days | 47% reduction |
| Value-added processing time | 4.2 days | 3.8 days | Reduced handling and rework |
| Waiting and queue time | 29.8 days | 14.2 days | 52% reduction |
| Total WIP | 17,100 t | 8,500 t | 50% reduction |
| Reheat furnace utilisation | 87% | 80–82% stable range | More resilience |
| Hot-mill style changeover | 75 minutes | 30 minutes | 60% reduction |
| First-pass yield | 91% | 96% | +5 percentage points |
| On-time delivery | 82% | 95% | +13 percentage points |
The improvement in furnace utilisation deserves attention. A lower utilisation percentage can represent better performance when it reflects reduced waiting, fewer emergency sequences and greater protection against variation. A constraint operating predictably is more valuable than a constraint operating continuously at its limit.
6. Kaizen Sequencing: Five Priority Bursts
The improvement sequence should follow the logic of the constraint and the flow:
-
Kaizen Burst 1 : Confirm the furnace constraint and stabilise daily control
- Validate capacity by grade, width and campaign.
- Establish an hourly furnace plan and Andon escalation.
- Expected impact: reduce schedule-related waiting by 2–3 days and improve visibility of lost capacity.
-
Kaizen Burst 2 : Reduce rolling and finishing changeovers
- Apply SMED to tooling, guides, rolls, coil preparation and documentation.
- Target hot-mill changeovers from 75 to 30 minutes.
- Expected impact: recover approximately 13.5 hours per month and support smaller campaigns.
-
Kaizen Burst 3 : Install WIP caps and FIFO control
- Mark physical FIFO lanes and define maximum quantities at each decoupling point.
- Escalate any breach within the same shift.
- Expected impact: reduce total WIP by 25–35% during the first implementation cycle.
-
Kaizen Burst 4 : Improve furnace sequencing and information flow
- Link customer due dates, grade families and rolling requirements in one visual schedule.
- Freeze the near-term sequence except for defined escalation conditions.
- Expected impact: improve on-time delivery by 6–8 percentage points.
-
Kaizen Burst 5 : Build quality at source
- Standardise slab and coil acceptance criteria.
- Use first-pass yield by grade, shift and campaign.
- Introduce root-cause reviews for recurring surface, gauge and chemistry defects.
- Expected impact: raise first-pass yield from 91% to 96% and remove avoidable rework queues.

7. Control the Gains Through DMAIC
This VSM fits naturally into the DMAIC framework:
- Define: establish the product family, scope and CTQs.
- Measure: validate lead time, WIP, changeovers, utilisation and first-pass yield.
- Analyse: use Pareto charts, process data, takt comparison, 5 Whys and capacity analysis to confirm root causes.
- Improve: implement campaign scheduling, SMED, WIP caps and furnace sequencing.
- Control: sustain the gains with visual management, standard work, daily reviews and control charts.
Use the Process Cycle Efficiency Calculator to quantify the relationship between value-added time and total lead time. For project governance, the Business Case Financial Calculator can connect lead-time reduction, recovered capacity and inventory release to financial outcomes.
A steel mill does not need to choose between operational discipline and commercial responsiveness. A well-designed future-state map creates both: a stable constraint, shorter queues, better quality and more reliable shipments.
Build the capability to map, analyse and improve complex value streams. Enrol in Lean 6 Sigma Hub’s CSSC-accredited Lean Six Sigma Black Belt training and learn to lead measurable improvement across capital-intensive operations.
Kaizen. Kai-Care. Kai-Done. ( Lean Six Sigma)