In logistics, speed is rarely determined by one warehouse activity or one carrier. It is determined by the entire chain: how an order enters the business, how it is released, how inventory is located and picked, how shipments are consolidated, how carriers exchange custody, and how delivery information returns to the customer.
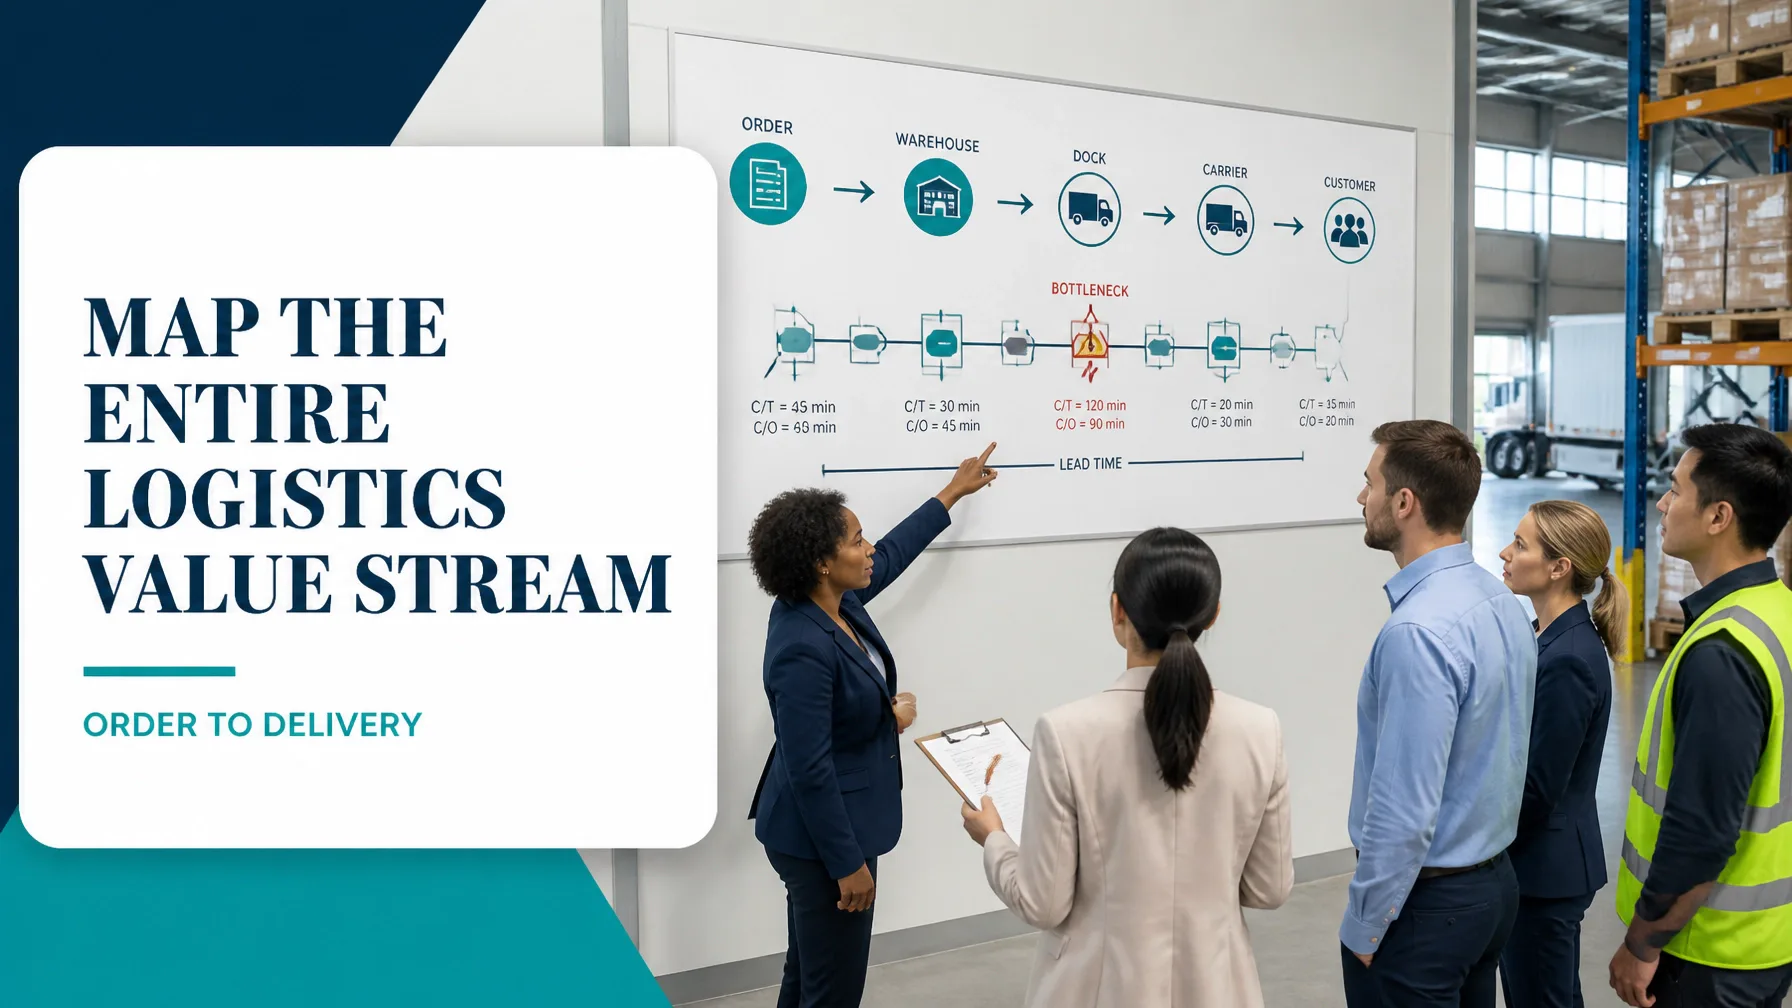
That is why value stream mapping in logistics must extend beyond a warehouse process map. A process map may show the sequence of activities. A logistics value stream map shows the relationship between material flow, information flow, waiting time, inventory, handoffs, capacity and customer demand across the complete order-to-delivery chain.
The result is a practical, data-driven view of where customer value is created: and where time, money and effort are being consumed without improving the delivery experience.
What Is Value Stream Mapping in Logistics?
Value stream mapping is a Lean method for documenting every significant step required to move a product or service from its starting point to the customer. The Lean Enterprise Institute defines value-stream mapping as the depiction of the material and information flows needed to bring a product from order to delivery.
In a logistics environment, the value stream may include:
- Customer order receipt and validation
- Order planning and release
- Inventory allocation
- Picking and replenishment
- Packing and labelling
- Staging and dock scheduling
- Carrier collection
- Line-haul and cross-docking
- Last-mile delivery
- Proof of delivery
- Returns and exception management
The fundamental purpose is not to create an attractive diagram. It is to understand how the system actually behaves.
A useful map captures:
- Cycle time: The time required to process an order, carton, pallet or shipment
- Lead time: The elapsed time from order receipt to delivery
- Waiting time: Time spent in queues, staging areas, planning backlogs or carrier windows
- Work in process: Orders, cartons, pallets or returns not yet completed
- First-pass yield: The percentage of orders completed without correction, rework or exception
- Handoffs: Transfers between departments, systems, sites, carriers or service providers
- Information accuracy: The percentage of orders, labels, documents and status messages that are complete and correct
Why Logistics Operations Need End-to-End Visibility
Many logistics organisations optimise locally. The warehouse measures pick rate, transport measures cost per shipment, procurement measures supplier price, and customer service measures complaints. Each metric may appear reasonable in isolation while the overall order-to-delivery performance remains weak.
For example, a warehouse may increase batch size to achieve a higher pick rate. However, this can create more staging inventory, delay urgent orders and increase loading congestion. A transport team may consolidate shipments to lower cost per unit, while customers experience longer delivery lead times. A planning team may release large waves to improve labour utilisation, creating downstream queues.
Value stream mapping connects these consequences.
It creates a common language for operations, planning, procurement, inventory control, transport, customer service, IT and finance. This system-wide view is consistent with the supply-chain application of VSM described by ASCM, where mapping reveals opportunities that are hidden when sites and functions are managed independently.

How to Scope a Logistics Value Stream
A map becomes difficult to use when its scope is either too broad or too vague. Begin with one product family, customer segment, lane or order type.
A strong initial scope might be:
From receipt of a standard B2B customer order in the ERP system to confirmed delivery at the customer site, including returns and delivery exceptions.
Use the following sequence:
-
Select the product family or order profile.
Choose orders with similar handling, storage, picking and transport requirements. -
Define the start point.
This may be order receipt, electronic data interchange transmission, customer portal submission or supplier dispatch. -
Define the end point.
Use proof of delivery, customer receipt, invoice approval or closed return, depending on the business objective. -
Identify the process owner and customer requirement.
Establish the required delivery window, order accuracy target and service-level agreement. -
Walk the actual flow.
Observe the process at the warehouse, dock, transport control tower and returns area. Compare physical observations with ERP, WMS and TMS timestamps. -
Collect representative data.
Avoid mapping only the fastest or most recent order. Use a sample that includes normal, urgent, late, incomplete and returned orders.
Worked Example: Current-State Order-to-Delivery Map
Consider a hypothetical regional distributor processing 1,200 orders per day through one distribution centre. The customer promise is delivery within three business days.
A team maps standard B2B orders over four weeks and records the following baseline:
| Process step | Processing time | Average waiting time | Key observation |
|---|---|---|---|
| Order receipt and validation | 8 minutes | 6 hours | Email orders are manually re-entered |
| Planning and release | 12 minutes | 14 hours | Orders are released in two daily waves |
| Inventory allocation | 5 minutes | 3 hours | Stock discrepancies require planner review |
| Picking and replenishment | 22 minutes | 2 hours | Pickers travel across multiple zones |
| Packing and documentation | 10 minutes | 5 hours | Orders wait for paperwork and consolidation |
| Dock staging and loading | 15 minutes | 7 hours | Fixed carrier collection windows create queues |
| Carrier handoffs and transport | 6 hours | 18 hours | Three handoffs across the primary lane |
| Delivery confirmation | 3 minutes | 8 hours | Proof of delivery is uploaded in batches |
| Total | 7 hours 17 minutes | 63 hours | Order-to-delivery lead time: 70 hours 17 minutes |
The total hands-on processing time is approximately 7.3 hours, while the complete order-to-delivery lead time is approximately 70.3 hours.
Using the Process Cycle Efficiency formula:
PCE = Value-Added Time ÷ Total Lead Time × 100
The current PCE is:
7.3 ÷ 70.3 × 100 = 10.4%
This means nearly 89.6% of elapsed time is consumed by waiting, queueing, information delays, movement, storage or handoffs.
The warehouse’s reported pick rate of 118 order lines per labour hour does not explain this result. The constraint is not simply picker productivity. The larger issue is the interaction between wave release, inventory verification, dock scheduling, carrier handoffs and batch status updates.
Teams can use the Process Cycle Efficiency Calculator to separate value-added work from waiting and rank the most significant sources of lost lead time.
Map Information Flow Alongside Material Flow
A logistics VSM is incomplete if it shows only cartons and pallets. Information often determines when material moves, where it moves and whether it moves at all.
Map the digital and human signals that control the physical flow:
- Customer order, EDI message or email
- ERP order validation and credit release
- WMS wave planning and pick-list creation
- Inventory allocation and replenishment signal
- TMS carrier booking and route plan
- Advanced shipping notice and loading confirmation
- Tracking events and exception alerts
- Proof of delivery and invoice release
- Return authorisation and disposition decision
Look specifically for duplicate entry. In the worked example, 22% of orders arrive by email, are entered manually into the ERP system and then rechecked by the warehouse team. This creates overprocessing, delay and defect risk before physical fulfilment begins.
The map should show where information is:
- Created
- Transferred
- Re-entered
- Approved
- Delayed
- Corrected
- Batch-released
- Disconnected from the physical shipment
Identifying the Eight Wastes in Logistics
The eight Lean wastes, commonly remembered as DOWNTIME, provide a disciplined lens for reviewing the current state.
1. Defects
Examples include mis-picks, incorrect labels, damaged cartons, missing customs documents, wrong carrier assignments and failed deliveries. In the example, a 3.8% order exception rate generates rework, customer-service contacts and additional transport.
2. Overproduction
Picking or packing orders before the customer requirement, transport availability or inventory need is confirmed creates unnecessary staging and handling.
3. Waiting
Orders wait for credit approval, inventory confirmation, wave release, replenishment, documentation, dock space, carrier collection or proof-of-delivery processing.
4. Non-utilised talent
Experienced warehouse operators may spend time searching for stock, correcting labels or manually reconciling systems instead of improving standard work and solving recurring problems.
5. Transportation
Unnecessary transfers between buildings, distribution centres, cross-docks or carrier depots increase cost and damage exposure. Multiple carrier handoffs are often visible as repeated transport loops.
6. Inventory
Excess safety stock, duplicate regional inventory, staged orders and returned goods awaiting disposition tie up capital and space.
7. Motion
Long walking routes, repeated forklift travel, searching for locations and moving pallets to access other pallets increase cycle time without improving customer value.
8. Extra-processing
Duplicate scans, repeated inspections, manual spreadsheet updates, re-keyed order data and repeated documentation checks are common examples.
Returns should be mapped as a connected loop, not as a separate afterthought. A returned item may pass through authorisation, collection, receiving, inspection, quarantine, refurbishment, restocking, disposal and refund approval. Each step can create additional waiting and inventory.
Designing the Future-State Logistics Value Stream
The future-state map should not simply remove boxes. It should establish a better operating logic.
For the hypothetical distributor, the improvement team proposes:
- Direct electronic order capture for standard customers
- A single integrated release signal from ERP to WMS and TMS
- Smaller, more frequent order releases instead of two large daily waves
- Zone-based slotting for high-frequency SKUs
- A supermarket replenishment system for fast-moving inventory
- Packing cells positioned beside dispatch lanes
- Dynamic dock scheduling based on shipment readiness
- One primary carrier handoff on the highest-volume route
- Real-time exception alerts rather than end-of-day reporting
- A defined returns cell with standard disposition rules

Current-State Versus Future-State Metrics
| Metric | Current state | Future state target | Improvement |
|---|---|---|---|
| Order-to-delivery lead time | 70.3 hours | 39.0 hours | 44.5% reduction |
| Order-entry waiting time | 6 hours | 30 minutes | 91.7% reduction |
| Planning and release waiting | 14 hours | 4 hours | 71.4% reduction |
| Dock staging waiting | 7 hours | 2.5 hours | 64.3% reduction |
| Carrier handoffs | 3 | 1 | 66.7% reduction |
| Pick rate | 118 lines/hour | 145 lines/hour | 22.9% increase |
| First-pass order accuracy | 96.2% | 99.2% | +3.0 percentage points |
| Inventory days | 21 days | 16 days | 23.8% reduction |
| Process Cycle Efficiency | 10.4% | 18.7% | +8.3 percentage points |
These are hypothetical targets, not guaranteed outcomes. The purpose of the future-state map is to establish measurable conditions that can be tested through pilots, kaizen events and DMAIC analysis.
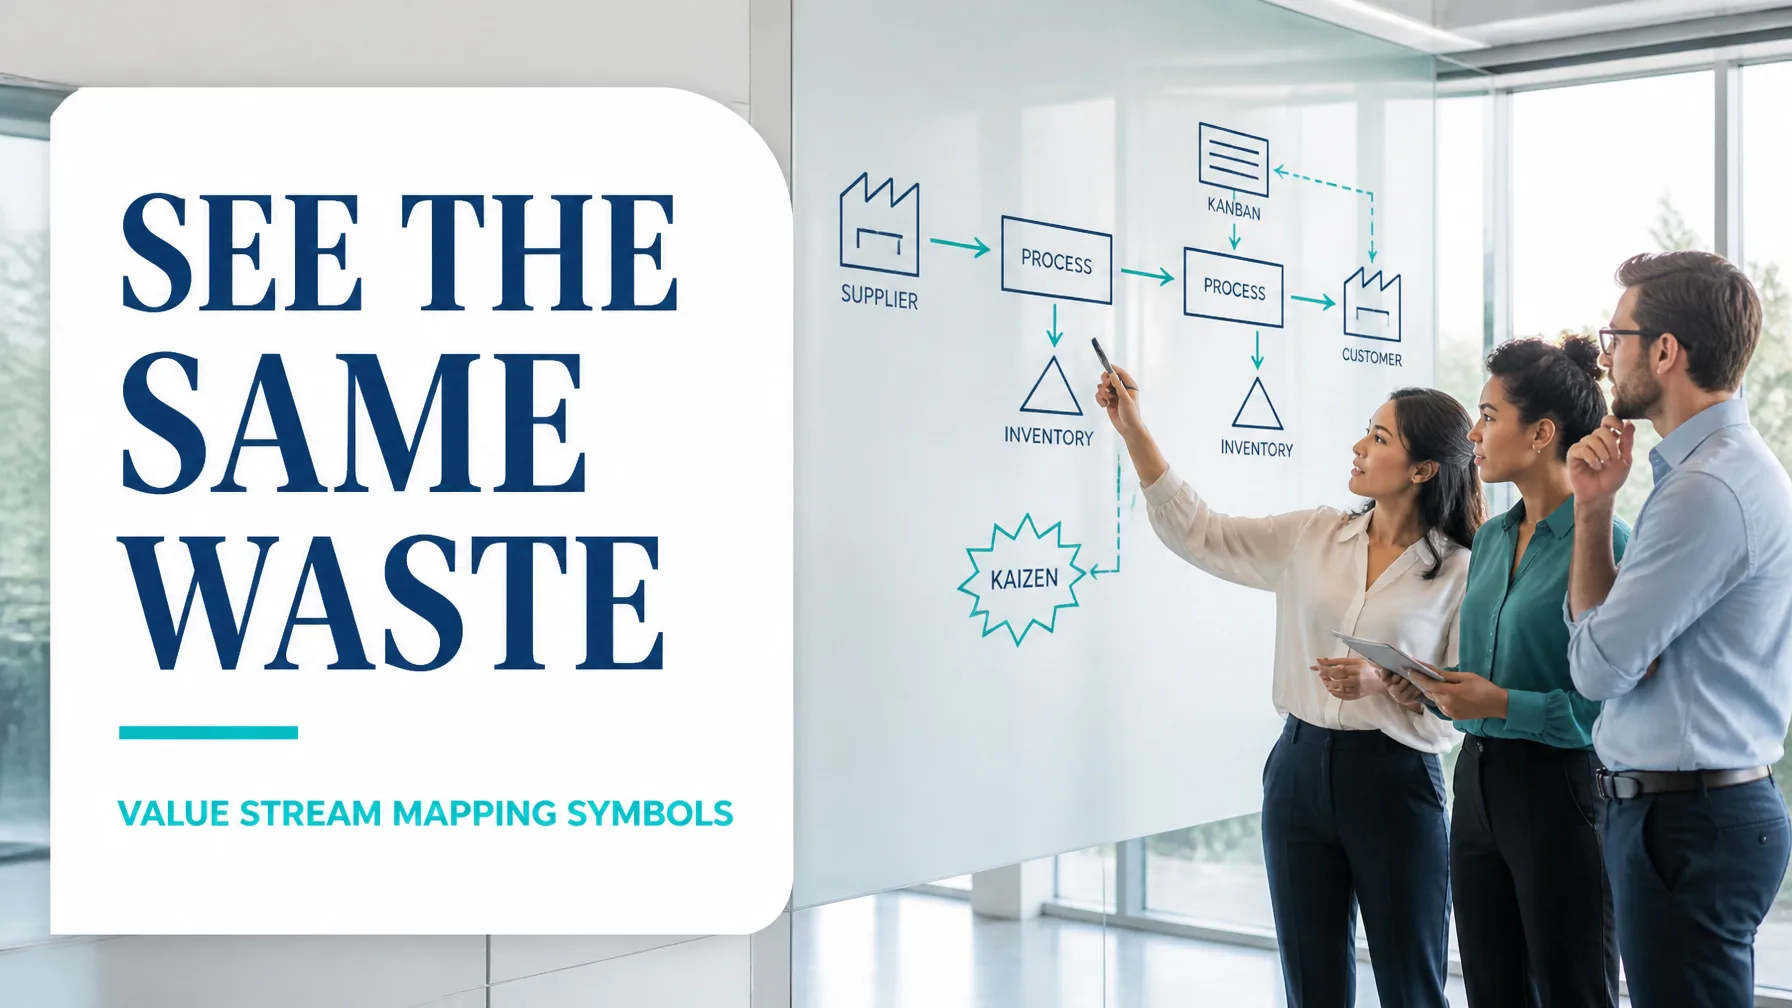
How to Prioritise Kaizen Bursts
A kaizen burst is a focused improvement opportunity marked directly on the value stream map. Do not prioritise every issue simultaneously. Rank each opportunity according to:
- Customer impact: Does it affect delivery time, accuracy or reliability?
- Lead-time impact: How many hours of waiting could it remove?
- Frequency: How often does the problem occur?
- Financial impact: What is the likely effect on labour, freight, inventory or rework?
- Feasibility: Can the team test the change without major capital investment?
- Risk reduction: Does the change reduce mis-shipments, damage or compliance exposure?
- System dependency: Does it require IT integration, supplier agreement or network redesign?
For the worked example, the first three kaizen bursts would be:
- Order capture: Eliminate manual re-entry for standard electronic orders.
- Dock flow: Replace fixed collection windows with shipment-ready scheduling.
- Carrier handoffs: Pilot a direct lane for the highest-volume customer region.
A fourth project should address inventory accuracy if stock discrepancies continue to interrupt allocation. Statistical analysis may then be required to determine whether errors are associated with SKU velocity, location, shift, replenishment method or operator training.
Build Capability Through Lean Six Sigma Training
Value stream mapping is most powerful when it is integrated with the broader Lean Six Sigma framework. Use Lean principles to improve flow, pull, visual management and waste reduction. Use Six Sigma methods to measure variation, validate causes and confirm that improvements are statistically and financially meaningful.
Professionals who want structured capability can explore Lean Six Sigma online training and certification, including:
- White Belt training for foundational awareness
- Yellow Belt training for team participation and basic improvement work
- Green Belt training for leading data-driven logistics projects
- Black Belt training for complex, cross-functional transformation
Lean 6 Sigma Hub provides CSSC-accredited, self-paced courses built around practical simulations, dummy data, charts, worked examples and end-to-end DMAIC case studies.
Final Takeaway
A logistics value stream map turns an apparently complex order-to-delivery network into a visible system of flows, queues, decisions and handoffs. It shows why improving one activity in isolation may not improve customer performance: and where a coordinated future state can reduce lead time, inventory and rework.
Start with one product family or delivery lane. Walk the actual process. Map information beside material. Measure waiting as carefully as processing. Then use kaizen bursts and DMAIC projects to convert the map into sustained performance.
Build the capability to map, analyse and improve logistics processes by pursuing Lean Six Sigma training and professional certification today.
Kaizen. Kai-Care. Kai-Done. ( Lean Six Sigma)