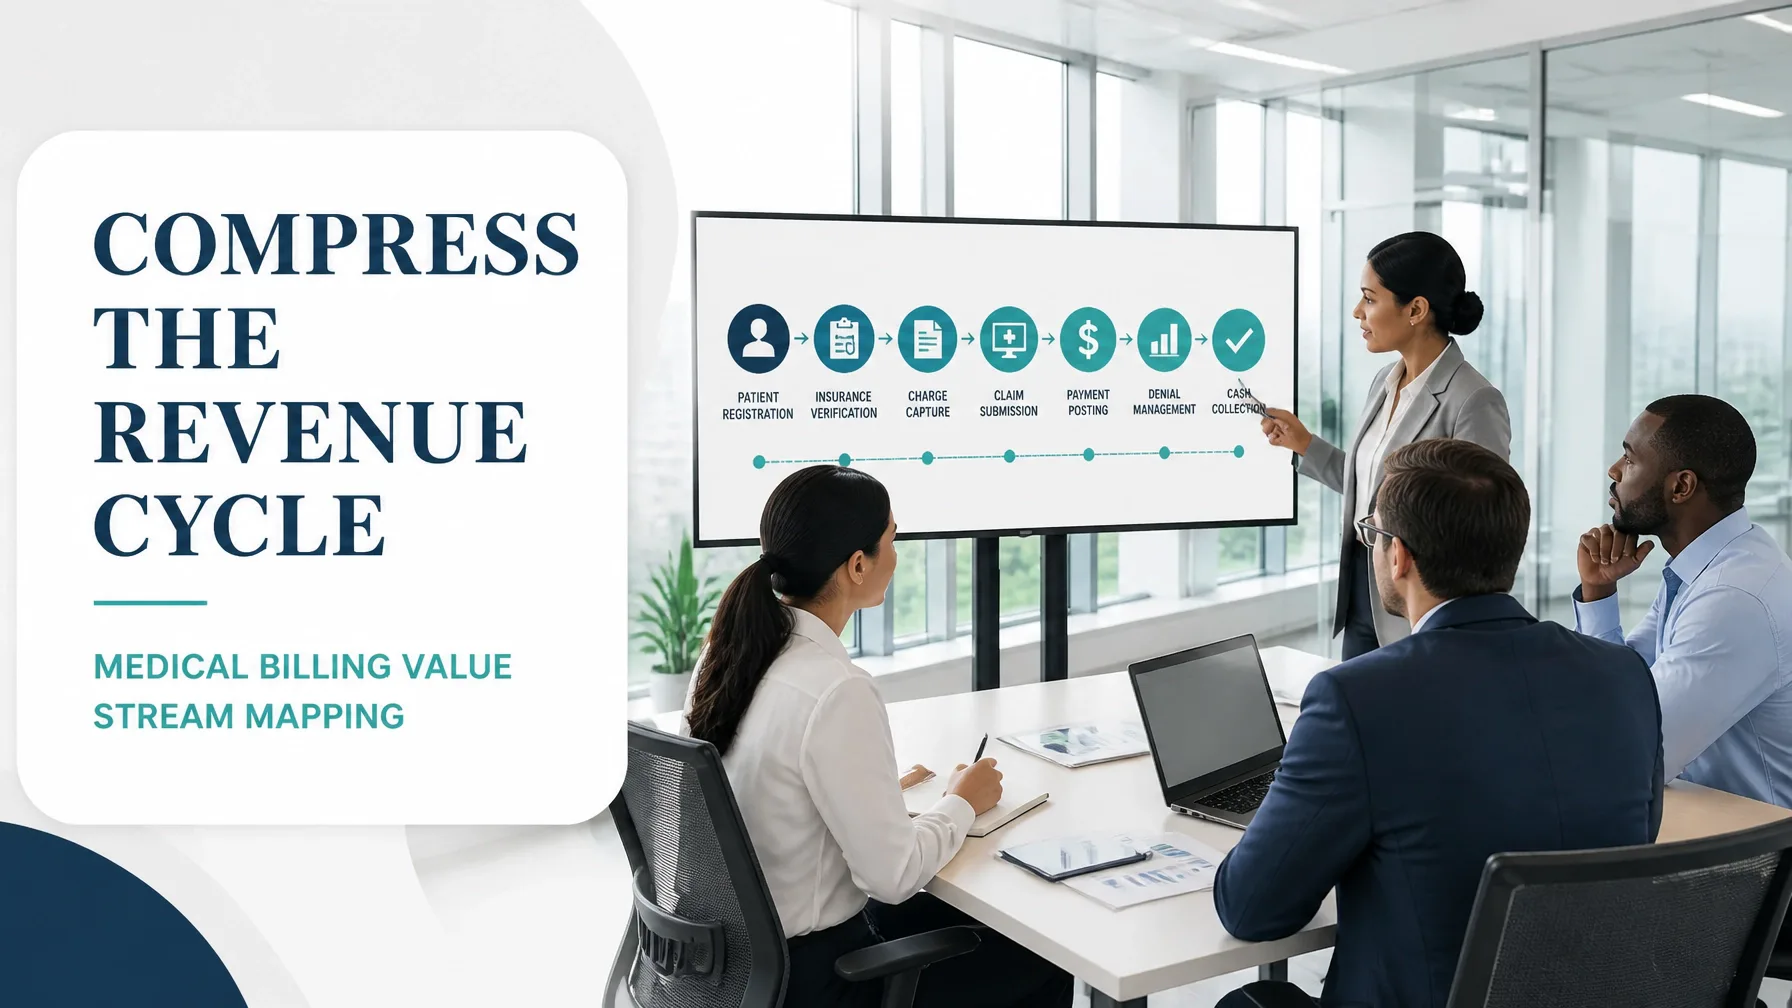
In finance, waste rarely appears as a pile of defective products or an idle production line. It is more likely to appear as an application waiting in a queue, a customer document entered into three systems, an approval email sitting unread, or a specialist repeatedly correcting incomplete information.
This is why value stream mapping in finance is so valuable. It makes the complete flow of customer demand, information, decisions, controls and work visible from beginning to end.
In a loan-to-approval pipeline, the customer may experience a process that takes days or weeks, even though employees actively work on the application for only a few hours. The difference is hidden in queues, handoffs, rework, system dwell time and policy-driven delays.
A finance-focused Value Stream Map converts that invisible delay into measurable improvement opportunities. Combined with Lean Six Sigma training, it gives banking and finance professionals a disciplined method for improving speed, quality, compliance and customer experience simultaneously.
Why financial process waste is difficult to see
The fundamental purpose of Value Stream Mapping is to visualise every step required to deliver an outcome, including the flow of information between people and systems. In manufacturing, the physical movement of materials makes waste easier to observe. In finance, the product is often a decision, transaction, record or approval.
That creates several challenges:
- Work is distributed across branches, operations teams, risk, compliance, technology and external providers.
- A process may cross several platforms, with no single system showing total elapsed time.
- “Processing time” is often confused with total lead time.
- Controls are added over time but are rarely reviewed as one connected system.
- Approval queues, inboxes and shared drives function as hidden work-in-process inventory.
- Rework may be recorded as a new task rather than as a defect in the original process.
Industry guidance on Value Stream Mapping emphasises the importance of mapping the end-to-end flow rather than optimising isolated departments. In banking, this means following one customer request from submission to a clear outcome.
Define the finance value stream before drawing the map
A useful map starts with an unambiguous boundary. For this article, consider a retail mortgage application.
Start point: A completed online mortgage application is submitted.
End point: The application receives an approval or decline decision, and the customer is notified.
The broader mortgage value stream could continue to contract preparation, settlement and servicing. However, limiting the first project to application-to-approval creates a manageable scope.
A typical sequence includes:
- Application intake and initial completeness check
- Identity and document verification
- Credit bureau enquiry
- Income and affordability assessment
- Property or collateral assessment
- Underwriting review
- Risk or policy exception review
- Final approval and customer notification
The map must include more than process boxes. It should show:
- Customer demand and application volume
- Roles responsible for each step
- Application queue size
- Processing time
- Waiting time
- Rework percentage
- Handoff count
- System used
- Information created or consumed
- Approval and escalation points
- Exception pathways

How to map a loan approval process in finance
Begin with a cross-functional workshop involving lending operations, underwriting, risk, compliance, technology, customer service and frontline staff. Senior leaders can explain policy intent, but process participants reveal how work actually flows.
1. Collect the current-state data
For each step, capture the following measures:
| Measure | Definition |
|---|---|
| Touch time | Time an employee or system actively works on the application |
| Queue time | Time the application waits before the next action |
| System dwell time | Time information remains in a platform, queue or integration state |
| Lead time | Total elapsed time from submission to decision |
| First-time-right rate | Percentage completed without correction or rework |
| Handoff count | Number of transfers between people, teams or systems |
| Exception rate | Percentage requiring manual review outside the standard path |
| Work in process | Applications currently awaiting completion |
A useful Lean metric is process cycle efficiency:
[
\text{Process Cycle Efficiency} =
\frac{\text{Total Value-Added Time}}{\text{Total Lead Time}} \times 100
]
The customer may value accurate assessment, a clear decision and timely communication. They generally do not value duplicate data entry, internal email routing or waiting for an avoidable approval.
2. Map information flow, not only task flow
Financial value streams are information streams. Draw the movement of:
- Customer-entered application data
- Identification documents
- Income evidence
- Credit information
- Valuation reports
- Underwriting recommendations
- Policy exceptions
- Approval records
- Customer communications
For every transfer, ask whether the receiving person or system receives complete, accurate and usable information.
For example, an application may be “submitted” in the loan origination system but remain in a technical queue for six hours before an integration sends it to the document verification platform. That six-hour period is system dwell time. It is operationally real even if no employee considers it a waiting task.
Process mining can complement Value Stream Mapping by using event logs to reveal actual paths, timestamps and exception patterns. Fluxicon provides a useful overview of how process mining and Lean Six Sigma can be combined.
Worked example: a mortgage application-to-approval pipeline
The following is a hypothetical case study designed to demonstrate the analysis method.
A regional lender processes 1,200 mortgage applications per month. Its current average lead time from online submission to decision is 10.5 calendar days, or approximately 252 elapsed hours.
The average application receives 8 handoffs across operations, verification, credit, underwriting, risk and approval. Employees actively work on the application for 6.8 hours, producing a process cycle efficiency of:
[
\frac{6.8}{252} \times 100 = 2.7%
]
The current state contains these characteristics:
- 18% of applications require missing-document follow-up.
- 14% require data correction or rekeying.
- 22% enter a manual exception pathway.
- Underwriting queue time averages 46 hours.
- Risk approval queue time averages 31 hours.
- System dwell time across integrations averages 17 hours.
- Average monthly operational effort is 8,160 FTE hours.
The map shows that the largest opportunity is not simply “work faster.” It is to remove avoidable waiting and prevent incomplete information from entering downstream queues.
Current-state step analysis
| Process step | Touch time | Waiting or system dwell time | Rework or exception signal |
|---|---|---|---|
| Application intake | 0.4 hours | 3 hours | 9% incomplete |
| Document verification | 1.1 hours | 28 hours | 18% missing documents |
| Credit assessment | 0.3 hours | 17 hours | 4% data mismatch |
| Affordability review | 1.2 hours | 36 hours | 14% rekeying |
| Property assessment | 0.6 hours | 42 hours | 8% external delay |
| Underwriting | 2.0 hours | 46 hours | 22% manual exceptions |
| Risk approval | 0.8 hours | 31 hours | 6% escalation |
| Final decision communication | 0.4 hours | 48 hours | Delayed batch release |
| Total | 6.8 hours | 251 hours | 8 handoffs |
The final communication step is particularly revealing. The decision is often complete, but customer notification is released in scheduled batches. The customer experiences additional delay even though the core value-adding decision has already been made.
Find the eight wastes in transactional finance
The eight DOWNTIME wastes apply to banking and knowledge work, although they appear as information, decisions and queues rather than physical materials.
- Defects: Incorrect data, incomplete documents, wrong product selection or inaccurate decision records.
- Overproduction: Generating reports, checks or approval packs before they are required.
- Waiting: Applications waiting for a reviewer, system response, signature or clarification.
- Non-utilised talent: Analysts spending specialist time on repetitive administration instead of complex judgement.
- Transportation: Moving files, emails or records between systems and teams.
- Inventory: Pending applications, unresolved exceptions and unprocessed document queues.
- Motion: Searching across systems, inboxes, folders and screens for information.
- Overprocessing: Duplicate checks, repeated approvals and manual transcription that add no meaningful control.
A practical test is to classify each activity as one of three types:
- Customer value: Directly contributes to the outcome the customer needs.
- Business, risk or regulatory value: Does not directly create customer value but is necessary for sound governance.
- Avoidable waste: Adds delay, cost or error exposure without a valid customer, business or regulatory purpose.
This distinction is important. The objective is not to remove every control. It is to make necessary controls effective, proportionate and correctly positioned in the flow.
Build a future state with straight-through processing
A future-state map should show how a complete, low-risk application can move through the process with minimal manual intervention, while exceptions receive focused expert attention.
For the hypothetical lender, the future state could include:
- Digital validation that prevents incomplete applications from being submitted.
- One authoritative customer-data record shared across platforms.
- Automated income and identity verification.
- Parallel credit, document and affordability checks.
- Rules-based routing for standard, low-risk applications.
- A dedicated exception lane for complex or policy-sensitive cases.
- Real-time alerts when an application exceeds a queue threshold.
- Immediate customer communication after the decision is recorded.
- Clear approval thresholds that reserve senior review for genuine exceptions.

Current state versus future state
| Metric | Current state | Future-state target | Improvement |
|---|---|---|---|
| Average lead time | 252 hours | 96 hours | 62% reduction |
| Touch time per application | 6.8 hours | 4.9 hours | 28% reduction |
| Process cycle efficiency | 2.7% | 5.1% | 89% relative increase |
| Handoffs | 8 | 4 | 50% reduction |
| Missing-document rework | 18% | 6% | 67% reduction |
| Data-rekeying defects | 14% | 3% | 79% reduction |
| Manual exception rate | 22% | 12% | 45% reduction |
| Straight-through processing | 20% | 65% | 45 percentage-point increase |
| Monthly FTE effort | 8,160 hours | 5,880 hours | 2,280 hours released |
These are improvement targets for the hypothetical example, not universal banking benchmarks. Each institution must validate its own baseline, regulatory obligations, product mix and customer risk profile.
Sequence Kaizen improvements across systems and policy
A future-state design becomes practical when improvements are sequenced rather than launched as one large transformation programme.
Wave 1: Stabilise the process
First, establish standard work and reliable measurement.
- Define the process start and end points.
- Create a single application-status vocabulary.
- Standardise document requirements.
- Remove duplicate spreadsheets and informal inbox queues.
- Establish daily visual management for aged applications.
- Measure lead time by product, channel and exception type.
Wave 2: Remove preventable defects
Next, improve the quality of information entering the stream.
- Add real-time completeness validation.
- Clarify customer instructions.
- Standardise data fields across application channels.
- Use error-proofing for mandatory information.
- Analyse the Pareto distribution of rework causes.
Wave 3: Integrate systems
Only after the process is stable should the organisation prioritise major technology changes.
- Eliminate manual rekeying.
- Connect identity, credit, income and document platforms.
- Create event timestamps for every significant status change.
- Reduce batch interfaces and unnecessary overnight cycles.
- Monitor failed integrations as process defects.
Wave 4: Simplify policy and automate the happy path
Finally, review whether policy design supports flow.
- Separate standard applications from complex exceptions.
- Align approval limits with risk exposure.
- Automate rules that are stable, transparent and auditable.
- Retain human judgement where interpretation and customer protection matter.
- Use governance checkpoints to prevent control gaps without creating universal queues.
The financial approval process guide can support the Define-phase governance work, while the Process Cycle Efficiency Calculator helps quantify the gap between active processing and elapsed time.
Make Value Stream Mapping a professional capability
Value Stream Mapping is not merely a workshop drawing. In finance, it is a method for connecting customer requirements, operational data, technology architecture, risk controls and improvement priorities.
Professionals who can map information flow, calculate process efficiency, identify transactional waste and design measurable future states are well positioned to lead meaningful banking transformation.
To fully appreciate the power of this approach, develop it within a structured Lean Six Sigma training pathway. Lean 6 Sigma Hub offers CSSC-accredited, self-paced certification from White Belt through Master Black Belt, with practical tools, case studies, charts, simulations and end-to-end DMAIC application.
Begin your Lean Six Sigma certification journey and learn to turn hidden financial-process waste into measurable flow, quality and customer value.
Kaizen. Kai-Care. Kai-Done. ( Lean Six Sigma)