Software delivery is often described as fast because coding can begin within hours. Yet many organisations still take weeks to move a feature from an approved idea to production. The reason is rarely the typing speed of developers. It is the invisible queue surrounding the work: waiting for clarification, design review, code review, test environments, security checks, release windows, and formal approval.
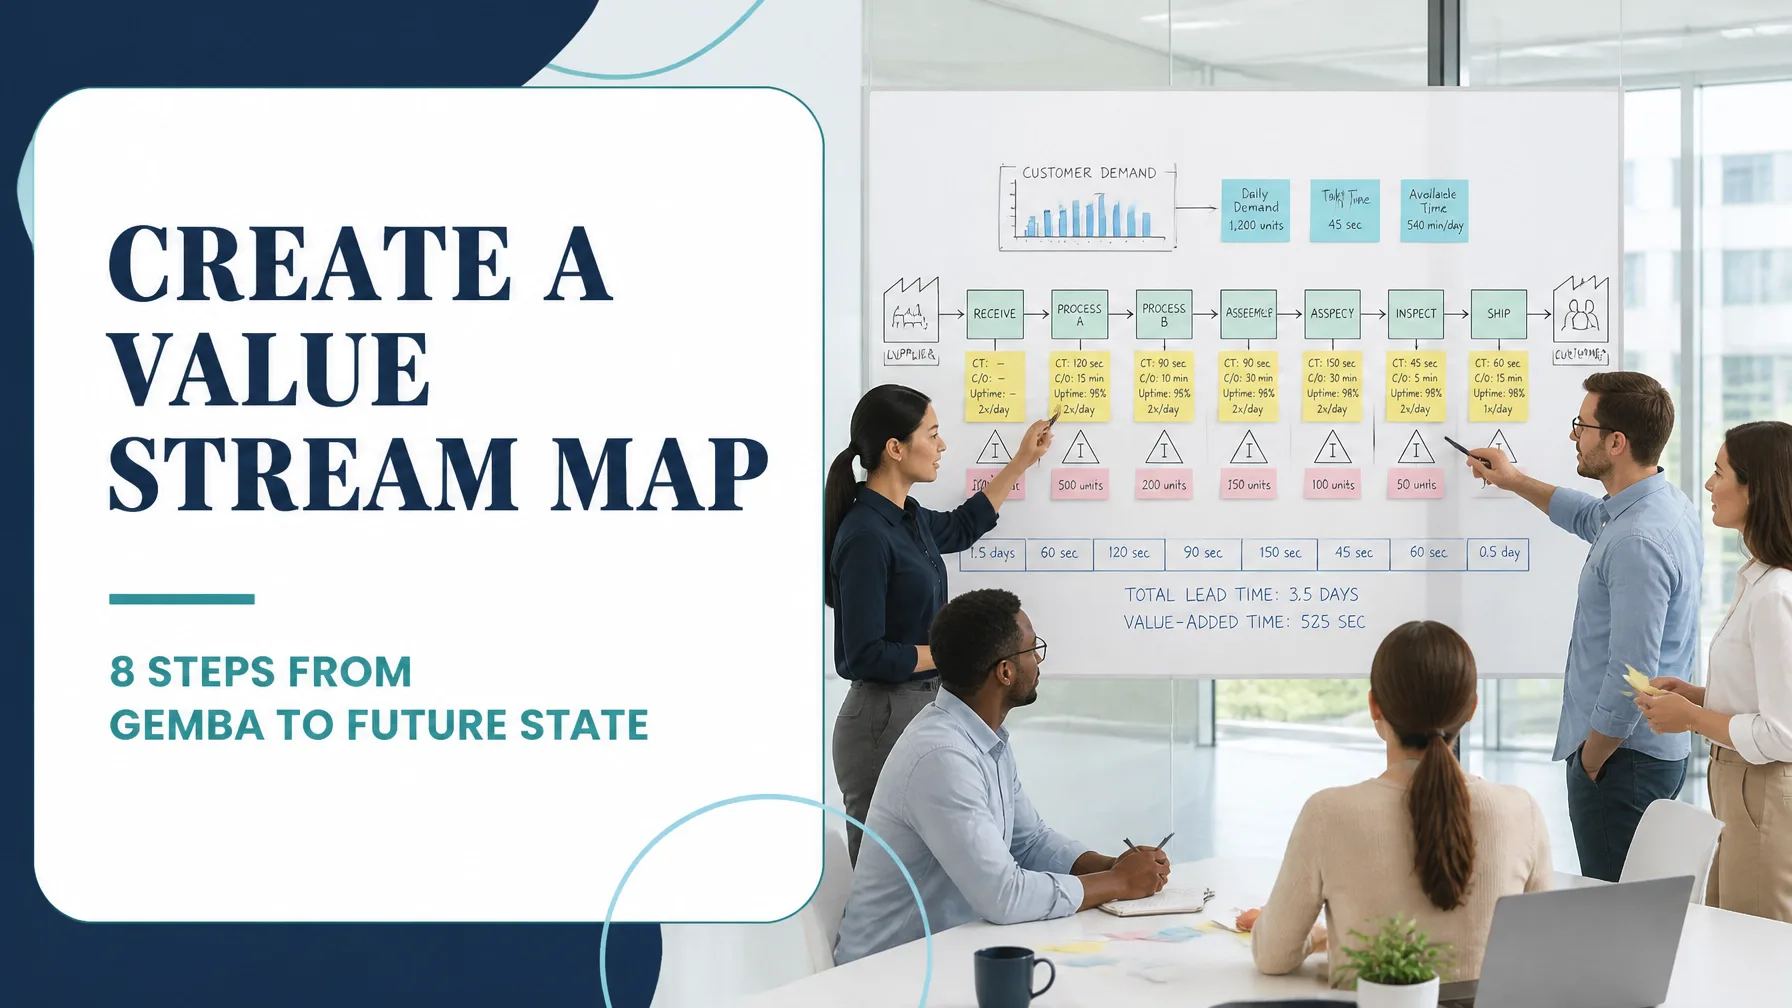
In the realm of software delivery, Value Stream Mapping (VSM) makes that invisible delay visible. It follows the complete software value stream from customer request to production, connecting work activities with waiting time, handoffs, defects, queues, and information flow.
When combined with Agile delivery and Lean Six Sigma, value stream mapping provides a disciplined method for improving flow without sacrificing quality or governance.
What Value Means in a Software Value Stream
Value is defined by what the customer needs and is willing to use: not by how much internal activity takes place. Coding, testing, and deployment may add value when they create a reliable capability for the user. Waiting for a meeting, re-entering information into another system, or correcting an avoidable defect does not.
A software value stream includes every step required to transform an idea into working software:
- Customer request or product opportunity
- Discovery and backlog refinement
- UX, architecture, and security design
- Development and code review
- Continuous integration and automated testing
- Manual quality assurance
- Approval and release coordination
- Deployment, monitoring, and customer feedback
DORA describes software delivery as having both a normal “happy path” and a recovery value stream for restoring service after incidents. This distinction matters because a team can improve feature delivery while still having a slow, fragile incident-recovery process.
A useful starting objective is specific and measurable, such as:
Reduce lead time from prioritised feature request to production deployment from 41.5 business days to 15 business days, while reducing change failure rate from 18% to below 10%.
How to Map a Feature From Intake to Production

A practical value stream mapping workshop should involve product, engineering, QA, security, operations, and: where possible: customer or service representatives. Keep the group cross-functional and small enough to make decisions.
1. Define the boundaries
Set a clear start and end point:
- Start: the moment a feature request is accepted into the delivery pipeline
- End: the feature is deployed, validated, monitored, and available to users
Do not limit the map to the CI/CD tooling if the principal delay occurs earlier in product discovery or approval.
2. Select representative work
Map five to ten recently completed features rather than one unusually successful example. Capture median and range data where possible. A single best-case ticket can produce a misleading current state.
3. Draw every actual step
Record what really happened, including informal workarounds. Typical stages include intake, discovery, design, coding, code review, CI testing, security, QA, approval, deployment, and post-production validation.
For each stage, record:
- Active processing time
- Waiting or queue time
- Number of items in process
- Handoffs and responsible teams
- Rework loops
- Approval gates
- First-pass quality
- Defects or failed deployments
4. Add information flow
The map should show more than tickets moving through a board. Identify how information moves:
- Customer feedback into product prioritisation
- Product requirements into design and development
- Pull requests into review
- Test results into release decisions
- Security findings into remediation
- Production telemetry into the backlog
A missing acceptance criterion may create more delay than a slow build server. Information quality is therefore part of process quality.
Worked Current-State Example: A Feature Pipeline
The following is a hypothetical example from a software-as-a-service team delivering customer-facing enhancements. The team reviewed 27 completed features over a three-month period.
| Stage | Active time | Waiting time | Stage lead time | Average WIP |
|---|---|---|---|---|
| Intake and clarification | 2 hours | 24 hours | 26 hours | 18 |
| Discovery and refinement | 6 hours | 32 hours | 38 hours | 12 |
| Design and architecture | 8 hours | 24 hours | 32 hours | 9 |
| Coding | 32 hours | 48 hours | 80 hours | 7 |
| Code review | 3 hours | 40 hours | 43 hours | 14 |
| CI build and automated tests | 5 hours | 8 hours | 13 hours | 6 |
| QA and security validation | 14 hours | 40 hours | 54 hours | 11 |
| Approval and release coordination | 2 hours | 32 hours | 34 hours | 8 |
| Deployment and validation | 1.5 hours | 10.5 hours | 12 hours | 4 |
| Total | 73.5 hours | 258.5 hours | 332 hours | 89 combined |
The feature requires 332 hours, or 41.5 business days, to reach production. However, only 73.5 hours involve active work. The process cycle efficiency is:
PCE = Value-added time ÷ Total lead time × 100
PCE = 73.5 ÷ 332 × 100 = 22.1%
The current state also shows:
- Change failure rate: 18%
- Deployment frequency: 2.4 deployments per week
- Median code-review wait: 40 hours
- Average WIP: 89 items distributed across the stream
- Rework from unclear requirements: 7 of 27 features
- Flaky-test-related delay: 11 of 27 features
Use the Process Cycle Efficiency Calculator to separate active work from queue time and rank the largest sources of delay.
The Eight Wastes Translated to Software

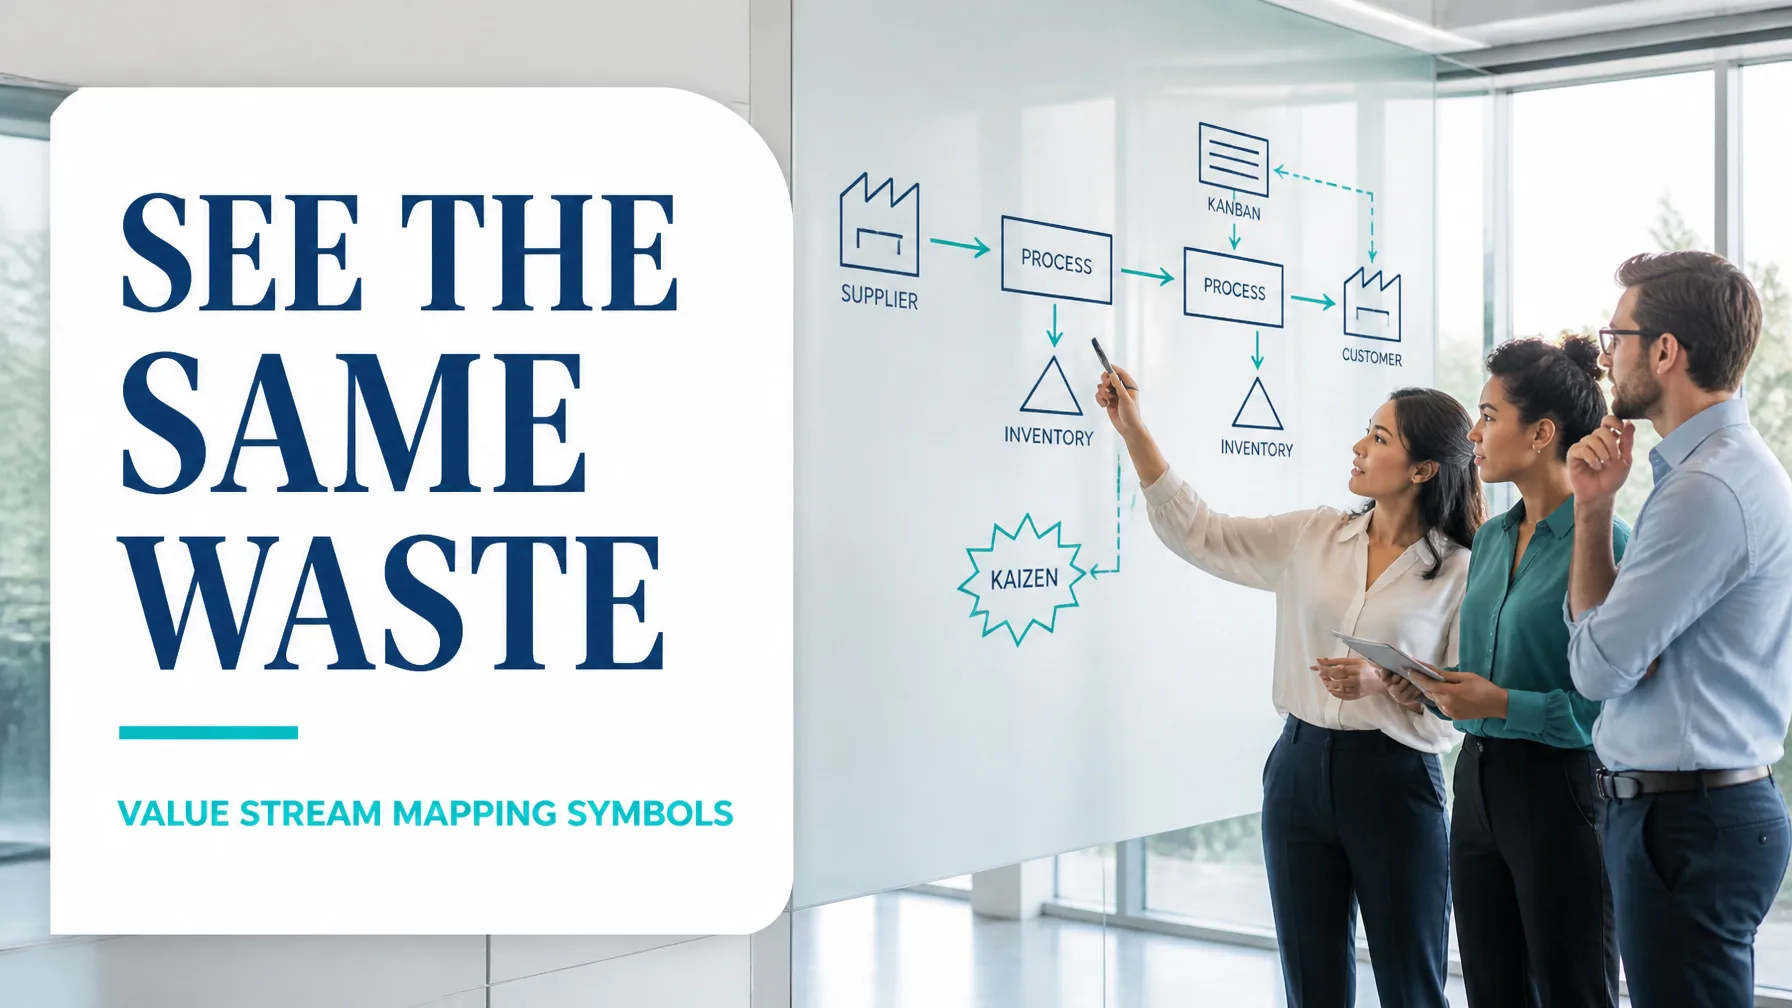
The eight DOWNTIME wastes provide a useful diagnostic lens:
- Defects: Production bugs, failed builds, security vulnerabilities, and incorrect acceptance criteria create rework.
- Overproduction: Developing features that users do not need increases backlog inventory and maintenance demand.
- Waiting: Engineers wait for reviews, environments, test results, product decisions, or release windows.
- Non-utilised talent: Skilled people spend time chasing approvals, reconciling spreadsheets, or repeating status updates.
- Transportation: Excessive movement of work between tools, repositories, teams, or communication channels increases friction.
- Inventory: Large backlogs, open pull requests, partially completed stories, and unused branches conceal delivery risk.
- Motion: Searching for documentation, switching dashboards, and attending unnecessary meetings consume time.
- Extra processing: Duplicate testing, repeated data entry, redundant approvals, and excessive documentation add effort without increasing customer value.
In software, Work in Process (WIP) is especially important. When too many features are started, the system creates longer queues, more context switching, and slower feedback. WIP limits should be applied to the entire value stream, not only to the development column.
Analyse the Map With Lean Six Sigma
The Analyse Phase of DMAIC asks why the delay and variation occur. A visual map identifies where to investigate; data validates the suspected causes.
Useful tools include:
- Pareto analysis to rank delay causes by total hours lost
- Box plots to compare cycle-time variation between teams or stages
- Run charts and control charts to identify shifts in review or deployment performance
- Correlation analysis to examine whether WIP is associated with longer lead time
- ANOVA to compare mean cycle times across products, teams, or release types
- Process capability analysis where a measurable service-level specification exists
For example, the team’s Pareto analysis found that code-review queues accounted for 72% of review-stage waiting. A box plot showed review lead time ranging from 4 to 96 hours, indicating substantial variation rather than a stable process. Further analysis found that review ownership was unclear and that pull requests larger than 600 lines of code were three times more likely to wait beyond 48 hours.
This is stronger than assuming “the developers need to work faster.” The evidence points to batch size, reviewer availability, and ownership design.
Approval Gates: Governance Without Unnecessary Bottlenecks
Approval supports risk management, compliance, and accountability. However, an approval gate can become a bottleneck when every change follows the same manual path regardless of risk.
Map each approval by asking:
- What risk does this gate control?
- What evidence does the approver need?
- Can the evidence be generated automatically?
- Can low-risk changes use a predefined pathway?
- Does the approver review work continuously or only during a scheduled meeting?
A risk-based model might allow automated tests, security scans, deployment evidence, and rollback plans to authorise low-risk changes automatically, while reserving human approval for high-risk releases.
Designing the Future State
A future-state software value stream should reduce batch size, shorten feedback loops, and automate reliable handoffs.
For the example team, the improvement plan included:
- Break large features into vertical slices deliverable within two to three days.
- Limit active development WIP to five items per team.
- Introduce a rotating code-review duty with a four-hour service target.
- Run unit, integration, and security tests in parallel.
- Move security checks earlier into the development workflow.
- Replace weekly release meetings with risk-based automated release criteria.
- Use feature flags and progressive deployment for controlled exposure.
- Create a single definition of ready and definition of done.
- Link deployment telemetry directly to the feature record.
- Establish a visible Andon-style signal for blocked builds, failed deployments, and urgent quality concerns.
The projected results were:
| Metric | Current state | Future state target |
|---|---|---|
| Request-to-production lead time | 41.5 business days | 14.5 business days |
| Active processing time | 73.5 hours | 59 hours |
| Waiting time | 258.5 hours | 57 hours |
| Process cycle efficiency | 22.1% | 50.9% |
| Average WIP | 89 items | 38 items |
| Change failure rate | 18% | 8% |
| Deployment frequency | 2.4 per week | 5 per week |
| Median code-review wait | 40 hours | 4 hours |
These are targets, not automatic outcomes. The team must validate them through controlled experiments and sustained measurement.
Running Kaizen on a CI/CD Pipeline

A focused kaizen event can improve a pipeline in days rather than waiting for a large transformation programme.
Use this sequence:
- Define the outcome: for example, reduce median commit-to-production time by 30%.
- Walk the current flow: observe the pipeline, review logs, and interview the people who operate it.
- Measure the constraint: capture queue time, build duration, failure frequency, and recovery time.
- Select one experiment: such as parallelising test suites or automating low-risk approval.
- Run the experiment on a limited service or team.
- Compare before-and-after data: include quality and stability metrics, not speed alone.
- Standardise the successful change: update procedures, ownership, dashboards, and training.
- Repeat against the next constraint.
Agile complements this approach because its iterative planning, small increments, and frequent feedback create ideal conditions for experimentation. Agile defines a flexible delivery rhythm; Lean Six Sigma provides the analytical discipline to understand variation, quantify waste, and control the gains.
Build Capability Through Lean Six Sigma Training
Value stream mapping is most effective when teams can connect visual flow analysis with DMAIC, root-cause analysis, process capability, control plans, and financial justification.
Professionals beginning their journey can explore Lean Six Sigma White Belt training, while practitioners supporting software improvement initiatives may benefit from Yellow Belt training. Those leading cross-functional delivery transformation can develop deeper capability through Green Belt or Black Belt certification.
The courses are CSSC-accredited, self-paced, and built around practical application, including simulations, worked examples, dummy data, charts, and end-to-end DMAIC projects.
Map your software value stream, measure the queue, and pursue Lean Six Sigma certification to lead faster, more reliable delivery.
Kaizen. Kai-Care. Kai-Done. ( Lean Six Sigma)