Construction projects rarely lose time in one dramatic event. More often, cost and schedule erosion accumulate through fragmented handoffs: an architect waits for a client decision, a contractor waits for an approved drawing, a supplier waits for a purchase order, and a crew waits for materials or access.
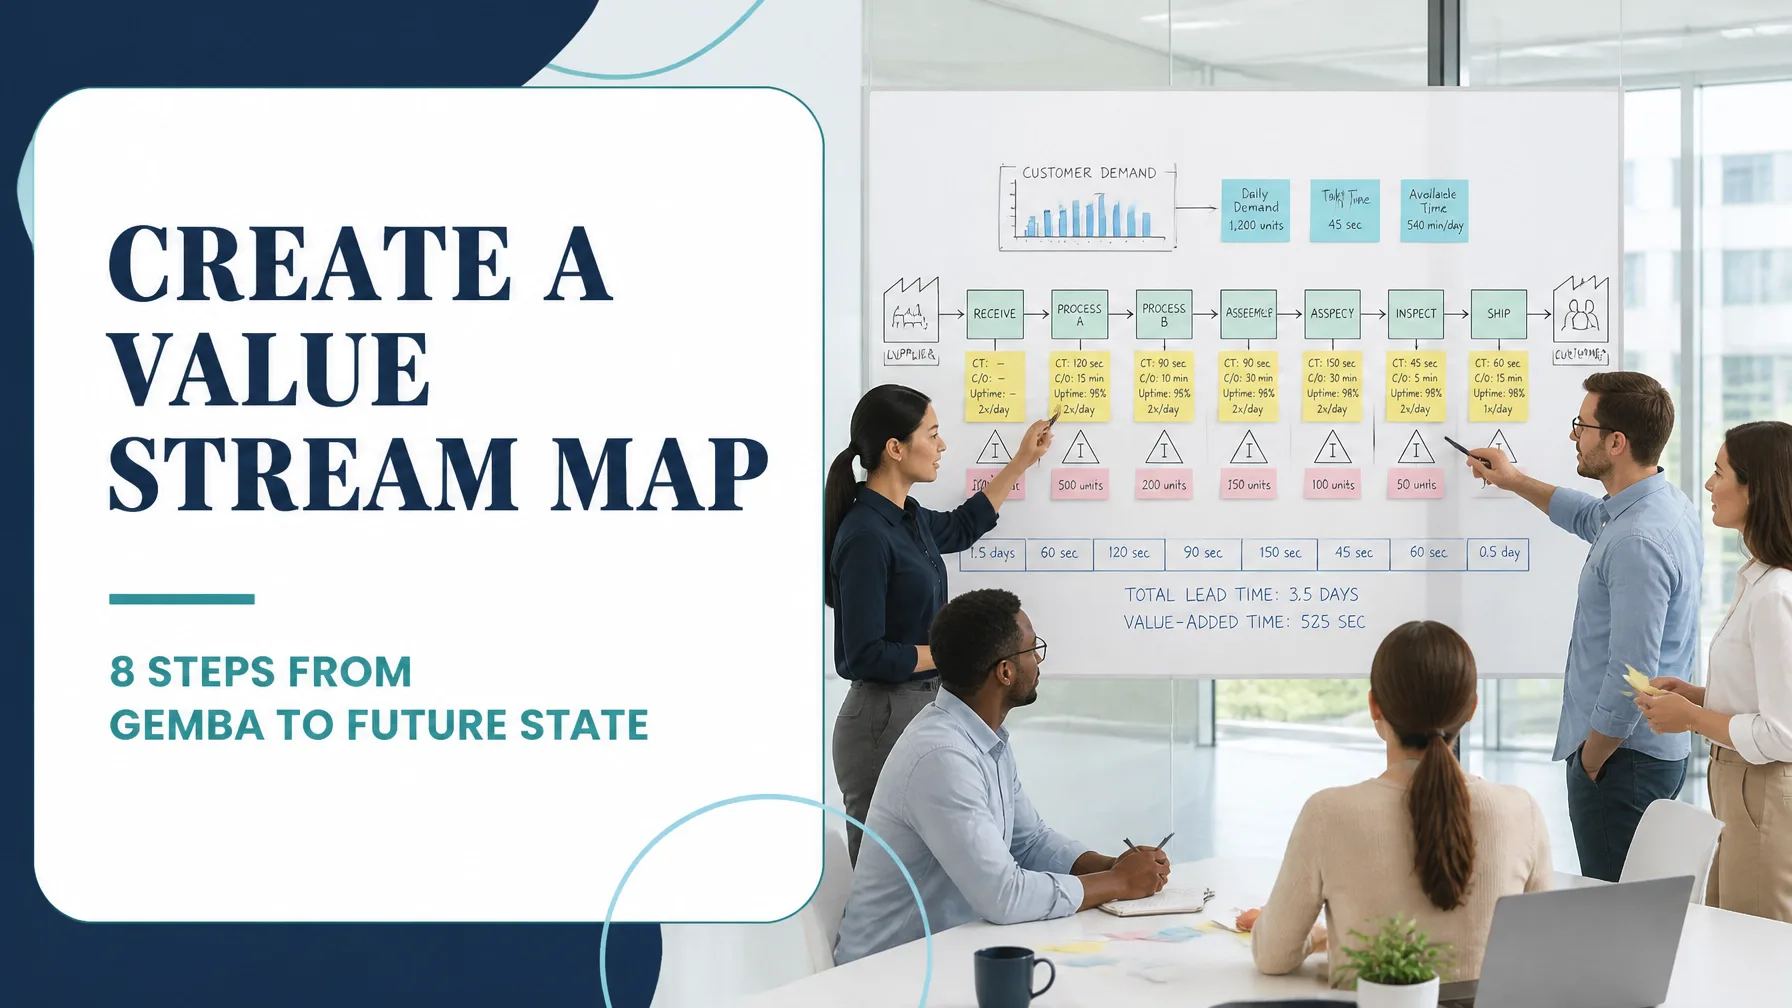
Value stream mapping makes this hidden delay visible. It charts the complete flow of information, materials and work from the initial blueprint through approvals, procurement, site installation, inspection and final handover. By attaching real data to every stage, project teams can distinguish productive work from waiting, rework, excess movement and administrative friction.
In the realm of lean construction, the map is more than a diagram. It is a decision-making instrument that helps teams improve flow, protect customer value and target the constraints that limit project delivery.
What Value Stream Mapping Means in Construction
A construction value stream includes every activity required to transform a client requirement into a completed, compliant and handed-over asset.
A typical end-to-end stream includes:
- Client brief and concept development
- Architectural and engineering design
- Design coordination and approval
- Permits and regulatory review
- Procurement and supplier release
- Material delivery and site logistics
- Trade installation and commissioning
- Inspection, testing and defect correction
- Documentation, client acceptance and handover
The fundamental purpose of value stream mapping is to examine the entire flow, not simply the efficiency of one trade or department. A concrete crew may be highly productive while the overall project remains slow because drawings, materials or inspections are not available at the right time.
For this reason, the map must show two connected streams:
- Information flow: client decisions, design revisions, RFIs, approvals, purchase orders, schedules and inspection requests.
- Material and work flow: drawings released to site, materials ordered and delivered, work packages installed, tested and accepted.
The first map should represent the current state. It should describe what actually happens, supported by observed data rather than the process described in a procedure.
How to Map the Current State From Blueprint to Handover
Begin with a cross-functional team that includes the owner’s representative, architect, design manager, contractor, site supervisor, procurement lead, key suppliers, quality personnel and trade representatives.
Then define the value stream boundary. For example:
“Approved design package received” to “completed building package accepted and handed over.”
Avoid mapping every activity on a large project at once. Select a representative work package, such as façade installation, mechanical services or a typical apartment floor. This makes the data collection practical while still exposing recurring system constraints.
During the walk-through, record:
- Process time: hands-on time spent completing the activity
- Queue time: time waiting before the next activity begins
- Lead time: total elapsed time from request to completion
- First-pass yield: percentage completed correctly without rework
- Work in process: drawings, RFIs, purchase orders, materials or unfinished work awaiting action
- Crew utilisation: productive crew hours divided by available crew hours
- Approval loops: number of submissions returned for clarification or revision
- Inspection waiting time: elapsed time between requesting and receiving inspection
- Material reliability: percentage of deliveries arriving on time and complete
A practical value stream map should also show rework loops. If a drawing is rejected, a material is delivered incorrectly or an installation fails inspection, that loop is part of the process: not an exception to be excluded.

Worked Example: A Commercial Fit-Out Project
Consider an illustrative commercial fit-out project involving 12,000 square metres across six floors. The project team reviews the design-to-handover stream for internal mechanical services.
The team analyses 18 recent work packages and collects the following baseline:
- Design coordination and approval lead time: 28 calendar days
- Active design and review time: 46 hours
- Average procurement lead time: 42 calendar days
- Procurement administration time: 16 hours
- Site installation cycle time: 10 working days
- Active installation time: 48 hours per work package
- Average inspection waiting time: 3.5 days
- Inspection and testing time: 6 hours
- Rework requirement: 16% of work packages
- Average rework time: 22 hours per affected package
- Crew utilisation: 62%
- First-pass inspection yield: 84%
- Expedited material deliveries: 18% of orders
- Handover documentation lead time: 12 days
The sequential lead time for this work package is approximately:
28 + 42 + 10 + 3.5 + 6 + 12 = 101.5 days
The team estimates 152 hours of active work across design, procurement, installation, inspection, rework and documentation. Using the Process Cycle Efficiency formula:
PCE = Value-Added Time ÷ Total Lead Time × 100
The baseline process cycle efficiency is approximately 18.7%, using a 24-hour calendar-day conversion for total elapsed time. The precise classification of value-added work should be agreed with the project team and customer; however, the calculation still demonstrates a central point: a significant portion of project time is consumed by queues, handoffs and correction loops.
The team also calculates an estimated annualised cost of poor quality for a construction division completing 20 comparable packages per year:
- Rework labour and supervision: $184,000
- Re-inspection and testing: $36,000
- Expedited freight and emergency procurement: $72,000
- Idle crew and equipment time: $128,000
- Client-driven delay exposure: $210,000
The resulting $630,000 opportunity becomes a strong input to the project business case. A value stream map gives leadership a clearer financial story than a general statement that “coordination needs improvement.”
Identifying the Eight Wastes in Construction Workflows
Lean Six Sigma uses the eight wastes as a structured lens for examining non-value-adding activity. In construction, these wastes often appear across organisational boundaries.
1. Defects
Incorrect drawings, wrong material specifications, incomplete installations and failed inspections create rework. In the example, a 16% rework rate means nearly one in six work packages requires additional effort.
2. Overproduction
Producing drawings, prefabricated components or materials before the downstream process is ready can create storage, damage and revision risk. Releasing too much work too early may increase activity while reducing flow.
3. Waiting
Waiting occurs when crews lack approved drawings, materials, access, information, equipment or inspection availability. It is often the largest source of elapsed time in construction.
4. Non-utilised talent
Site supervisors, tradespeople and suppliers frequently identify practical improvements, but their knowledge is not always included in planning or design reviews. Failing to use this expertise weakens both problem-solving and engagement.
5. Transportation
Repeated movement of materials between storage areas, floors and work zones adds handling time and damage risk. Unplanned deliveries can also disrupt site logistics.
6. Inventory
Excess materials, unfinished work and large queues of unresolved RFIs represent capital and attention tied up in the system. Inventory can conceal poor flow rather than solve it.
7. Motion
Workers may travel long distances to locate tools, collect materials, clarify instructions or access shared equipment. A simple observation study may reveal several hours of avoidable movement per crew each week.
8. Extra-processing
Duplicate approvals, repeated data entry, unnecessary inspections and multiple versions of the same drawing increase effort without increasing customer value.
The map should quantify each waste wherever possible. For example, a site observation may show that a crew spends 74 minutes per shift locating materials and walking to shared equipment. Across a six-person crew and 40 working days, that represents 296 labour hours of avoidable motion.
Mapping Information Flow Between Stakeholders
Construction performance depends heavily on the quality and speed of information exchange.
A useful information-flow map should show:
- The owner defining requirements, budget, quality expectations and acceptance criteria
- The architect and engineers developing, coordinating and revising the design
- The contractor translating approved information into packages, schedules and site execution
- Suppliers and subcontractors confirming specifications, lead times, availability and delivery constraints
- Inspectors and authorities providing compliance requirements and release decisions
In the current-state example, the team finds that design questions are submitted through three channels: email, a project platform and informal messaging. Average RFI response time is 6.2 days, with 31% requiring at least one clarification cycle.
The future state standardises the flow:
- One RFI register becomes the controlled source of truth.
- Each RFI receives an owner, due date and response category.
- Design packages use a completeness checklist before submission.
- Approval service levels are defined: for example, three business days for routine reviews.
- Suppliers receive a controlled release package rather than partial information.
- Site supervisors confirm readiness before materials are dispatched.
This is not an attempt to remove necessary governance. Instead, it separates essential approval from avoidable administrative delay.
Building the Future State: Pull-Based Materials and Smoother Approvals
The future-state map should describe a more reliable flow, not an idealised picture disconnected from site realities.
For the worked example, the team introduces:
- Pull-based material delivery: materials are released according to confirmed installation readiness rather than a broad forecast.
- Two-bin or kanban signals: replenishment is triggered by actual consumption and agreed minimum quantities.
- Weekly readiness reviews: design, procurement and site teams confirm that the next work package has drawings, materials, access and labour.
- Standard approval windows: review responsibilities and response times are explicit.
- First-time-right submission checks: drawings and material orders are verified before entering the approval queue.
- Point-of-use storage: materials are delivered to the correct work zone in sequence.
- Visual management: the site board displays package status, constraints, inspection dates and escalation requirements.
The projected results are shown below.
| Metric | Current state | Future state | Improvement |
|---|---|---|---|
| Design-to-approval lead time | 28 days | 14 days | 50% reduction |
| Procurement lead time | 42 days | 24 days | 43% reduction |
| Installation cycle time | 10 days | 8 days | 20% reduction |
| Inspection waiting time | 3.5 days | 1 day | 71% reduction |
| Rework rate | 16% | 5% | 11 percentage points |
| Crew utilisation | 62% | 79% | 17 percentage points |
| First-pass inspection yield | 84% | 95% | 11 percentage points |
| Expedited material deliveries | 18% | 5% | 13 percentage points |
| Handover documentation lead time | 12 days | 6 days | 50% reduction |
| Total work-package lead time | 101.5 days | 64 days | 37% reduction |
The projected future state reduces lead time by 37.5 days while improving quality and crew utilisation. The improvement is not based on asking people to work faster. It comes from reducing queue time, preventing incomplete handoffs and synchronising material supply with actual site readiness.

Running Kaizen Events in the Field
A construction kaizen event should be short, practical and anchored in observed work. A three-day event may be structured as follows:
Day one: Observe and validate
- Walk the process from design release to installation
- Confirm current-state data with the people doing the work
- Photograph or record movement, queues and material conditions where permitted
- Identify the largest constraints and customer-impacting delays
Day two: Design countermeasures
- Separate symptoms from verified causes
- Prioritise improvements using impact, effort, safety and feasibility
- Design the future-state flow
- Draft standard work for approvals, readiness checks and material release
Day three: Pilot and commit
- Test one improvement on a live work package
- Measure cycle time, waiting, defects and crew utilisation
- Record lessons and revise the method
- Assign owners, due dates and control measures
A kaizen event should finish with a control plan. For example, the project team may review weekly:
- Percentage of work packages ready before the planned start
- Approval turnaround time
- First-pass inspection yield
- Material delivery completeness
- Rework hours
- Crew utilisation

Connect Construction Improvement With Lean Six Sigma Training
Value stream mapping is most effective when it is connected to the wider Lean Six Sigma framework. The map supports Measure by establishing a baseline, Analyse by exposing bottlenecks and root-cause patterns, Improve by guiding future-state design, and Control by defining the indicators that must be sustained.
Construction professionals can also combine VSM with:
- SIPOC and process mapping during Define
- Time observation sheets during Measure
- Pareto analysis for rework and delay categories
- Cause-and-effect diagrams for recurring defects
- FMEA for high-risk work packages
- Control plans and visual management during Control
Our Process Cycle Efficiency Calculator can help teams quantify the proportion of lead time spent on value-adding work. The Cost of Poor Quality Calculator can support the financial case by converting rework, delay and failure costs into a structured opportunity.
For a broader foundation, explore the Lean Six Sigma Practitioner Guide and our online Lean Six Sigma training pathways. A Green Belt certification is particularly relevant for professionals leading data-driven improvement projects, while Black Belt training develops the capability to lead complex, cross-functional change.
Build the capability to map construction value streams, remove waste and deliver measurable improvement: pursue Lean Six Sigma training and certification today.
Kaizen. Kai-Care. Kai-Done. ( Lean Six Sigma)