In the realm of operational excellence, few sights are as disheartening to a Master Black Belt as a process map that lacks accountability. We have all witnessed the "Not My Job" wars: the friction that occurs when a task falls through the cracks, only for two departments to point fingers at one another. This dysfunction is rarely a result of poor intent; rather, it is a structural failure caused by invisible boundaries.
To fully appreciate the gravity of this issue, one must understand that a standard flowchart: while useful for identifying steps: fails to identify owners. This is where the Swimlane Map becomes an indispensable tool. According to the Lean 6 Sigma Hub Glossary, a Swimlane Map visually represents a process and how tasks flow between different departments or roles. By categorizing activities into distinct horizontal or vertical lanes, we expose the "white space" in an organization: the dangerous gaps where handoffs fail and efficiency dies.
The Technical Anatomy of a Swimlane Map
A Swimlane Map, often referred to as a functional deployment map, is not merely a drawing; it is a diagnostic instrument. The fundamental purpose of this tool is to delineate boundaries. In a complex process, such as order fulfillment or product development, dozens of stakeholders are involved. Without a swimlane, the "Measure Phase" of a DMAIC project becomes a subjective exercise in guesswork.
To construct a robust map, practitioners must utilize specific symbols and structures:
- The Lanes: Each lane represents a functional department (e.g., Sales, Engineering, Logistics) or a specific role.
- The Tasks (Rectangles): These signify value-added or non-value-added activities.
- The Handoffs (Connectors): These represent the most critical points of the process: where information or material moves from one lane to another.
- The Decision Points (Diamonds): Where the process may branch based on specific criteria.
When a process is mapped this way, the "Not My Job" attitude is neutralized because the visual evidence is undeniable. If a connector line ends in a vacuum, or if two departments claim the same rectangle, the process is objectively "a mess."
Why Your Current Mapping Efforts Are Failing
Most organizations struggle with Swimlane Maps because they treat them as a "once-and-done" artistic exercise rather than a living document. There are three primary reasons why these maps fail to resolve cross-functional conflict:
1. Alignment with Organizational Silos instead of Value Streams
The most common mistake is creating lanes that reinforce departmental silos rather than focusing on the customer’s journey. When the map is aligned too strictly with internal politics, it fails to show how value is actually created. To address this, practitioners should often start with a high-level overview using a SIPOC Complexity Score Calculator to ensure they aren't over-complicating the technical scope before diving into the lanes.
2. Missing Handoff Protocols
A handoff is not just a line on a page; it is a contract. In a messy swimlane map, the line between "Marketing" and "Sales" is just a line. In a high-functioning map, that line represents a defined set of "Critical to Quality" (CTQ) requirements. If the receiver’s requirements aren't met, the handoff fails. This lack of definition is the breeding ground for the "Not My Job" mentality.
3. Lack of Operational Detail
Many maps suffer from Issue #5 identified in industry research: managing the wrong level of detail. A map that is too high-level misses the friction points, while one that is too granular becomes unreadable. Finding the "Goldilocks" zone of detail is essential for process mapping in the Measure phase.

Stopping the "Not My Job" Wars: A Tactical Guide
To eliminate cross-functional friction, leadership must use the Swimlane Map to redefine accountability. This involves a three-step protocol designed to transform a static diagram into a tool for cultural change.
Step 1: Identify the "Orphaned" Tasks
During the mapping session, look for tasks that sit on the lines between lanes or tasks that have no clear owner. These are "orphaned" tasks. In a hypothetical case study of a mid-sized manufacturing firm, orphaned tasks in the "Change Order" process were responsible for a 22% increase in lead time. By assigning these tasks to a specific lane and defining the necessary inputs, the firm reduced its DPMO (Defects Per Million Opportunities) significantly. You can use our DPMO and Sigma Conversion Guide to quantify these improvements.
Step 2: Define Handoff "Tollgates"
Treat every cross-lane line as a mini-tollgate. Just as a project requires a Tollgate Review to move from Measure to Analyze, a task should not leave a lane unless it meets the predefined standards of the next lane. This forces departments to communicate and agree on what "ready" looks like, effectively ending the war of shifting blame.
Step 3: Document the Change
Visualizing the mess is only half the battle. To ensure long-term success, the new state must be codified. This requires rigorous attention to how you document your process changes. If the map isn't backed by a Standard Operating Procedure (SOP), the organization will default to its old, siloed habits within weeks.
Integrating the Swimlane into the RDMAICS Framework
The Swimlane Map is most effective when utilized within a structured improvement framework like RDMAICS (Recognise, Define, Measure, Analyse, Improve, Control, Sustain).
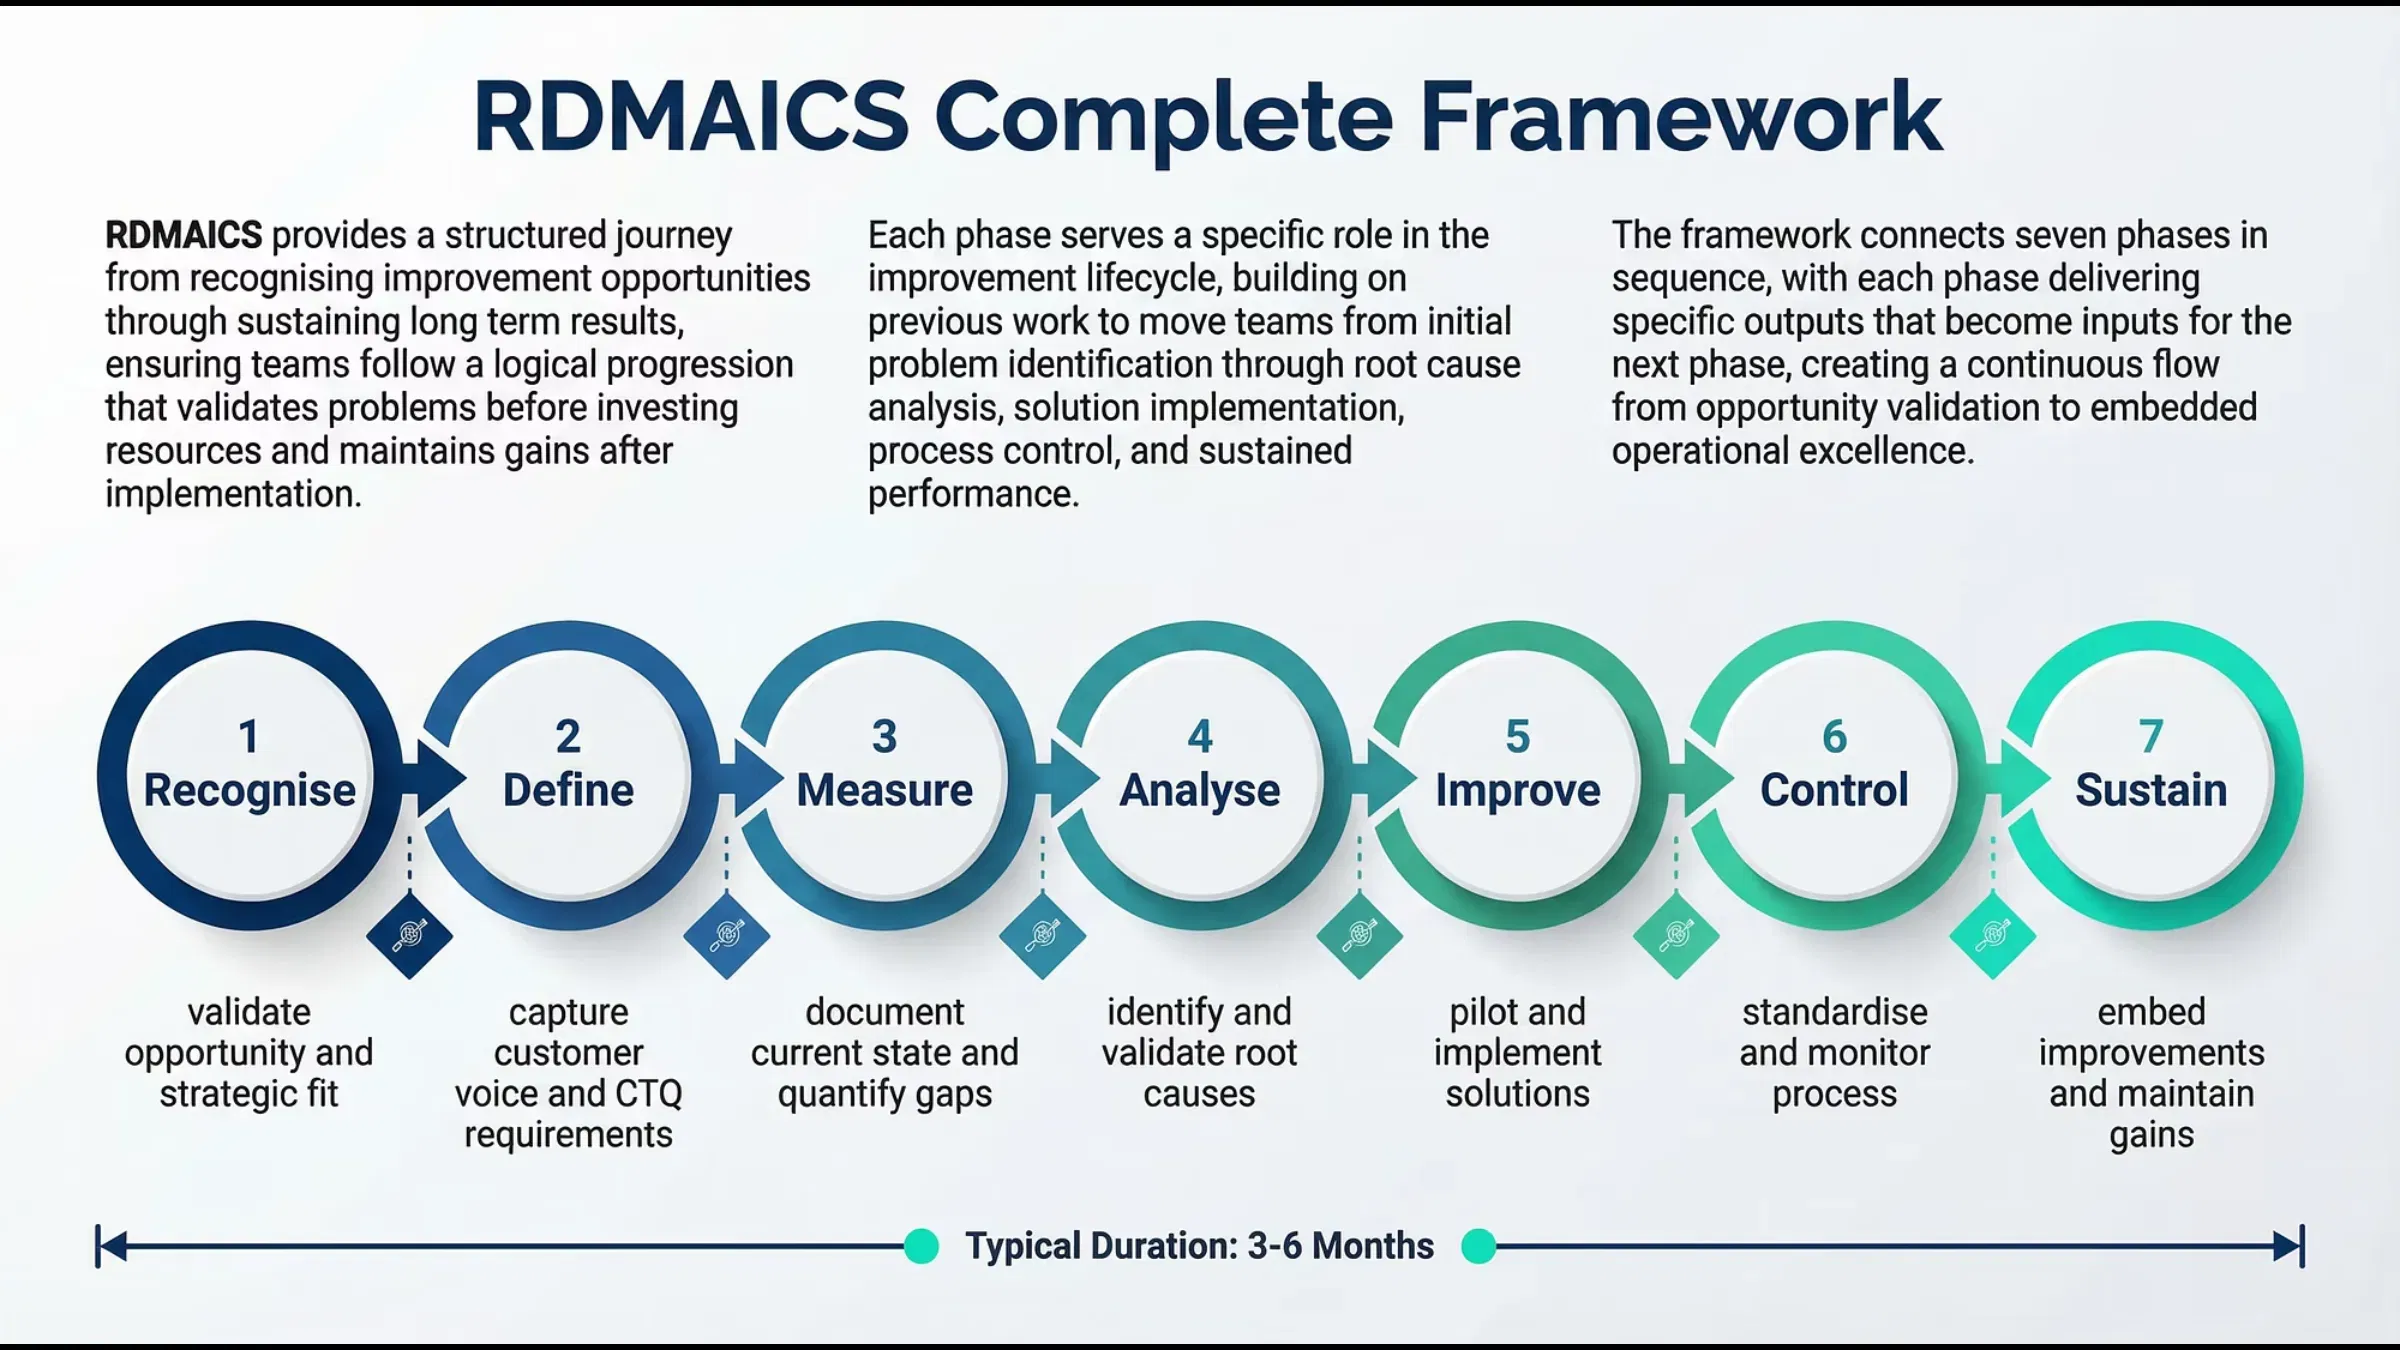
In the Define phase, the map helps clarify the scope of the project. In the Measure phase, it provides the baseline for current state performance. However, its true power is realized in the Improve phase. Here, the team creates a "To-Be" map that eliminates redundant steps and clarifies ownership. By comparing the "As-Is" and "To-Be" states, leadership can calculate the potential ROI of the improvement using a Project Charter ROI Calculator.
The Role of Leadership in Resolving Conflict
Technological tools alone cannot stop "Not My Job" wars. It requires a shift in mindset from "Who did it?" to "Why did the process allow this to happen?" Leadership must champion the Swimlane Map as a "No-Blame" diagnostic tool.
When a defect occurs, the first question should be: "Where on the Swimlane Map did the handoff fail?" This shifts the focus from individual performance to systemic health. If the failure occurred because a lane was overloaded, the solution might involve Robotic Process Automation (RPA) to handle repetitive tasks, freeing up human capital for higher-value activities.
Advanced Techniques: Beyond the Basics
For those seeking to master the art of cross-functional harmony, consider the following advanced applications of Swimlane Mapping:
- Cross-Functional Impact Assessments: Before implementing a change, use a Stakeholder Impact Assessment Calculator to see which lanes will be most affected.
- Voice of the Customer (VOC) Alignment: Ensure that the final lane (usually Delivery or Customer Service) is directly meeting the requirements identified in a VOC Priority Matrix.
- Data Normality Testing: In the Measure phase, if a lane shows highly variable completion times, you may need to perform a Shapiro-Wilk test to see if your process data follows a normal distribution, indicating whether the "mess" is due to common cause or special cause variation.
Conclusion: Turning Visuals into Victory
A Swimlane Map is the ultimate antidote to organizational ambiguity. By forcing every task into a lane and every handoff into the light, you eliminate the shadows where "Not My Job" attitudes hide. However, simply drawing the map is not enough. You must have the skills to analyze the flow, identify the bottlenecks, and lead the team toward a more collaborative future.
If your organization is suffering from silo-driven conflict, it is time to move beyond basic diagrams and embrace the full rigor of Lean Six Sigma methodology. Whether you are looking for Quick Wins or Long-Term Solutions, professional certification provides the framework necessary to manage these complex dynamics.

To stop the "Not My Job" wars and master the art of cross-functional process mapping, enroll in our Lean Six Sigma Green Belt or Black Belt certification programs today. Gain the tools, the data, and the authority to transform your organization’s efficiency.